Signal Ocean – Maritime SaaS
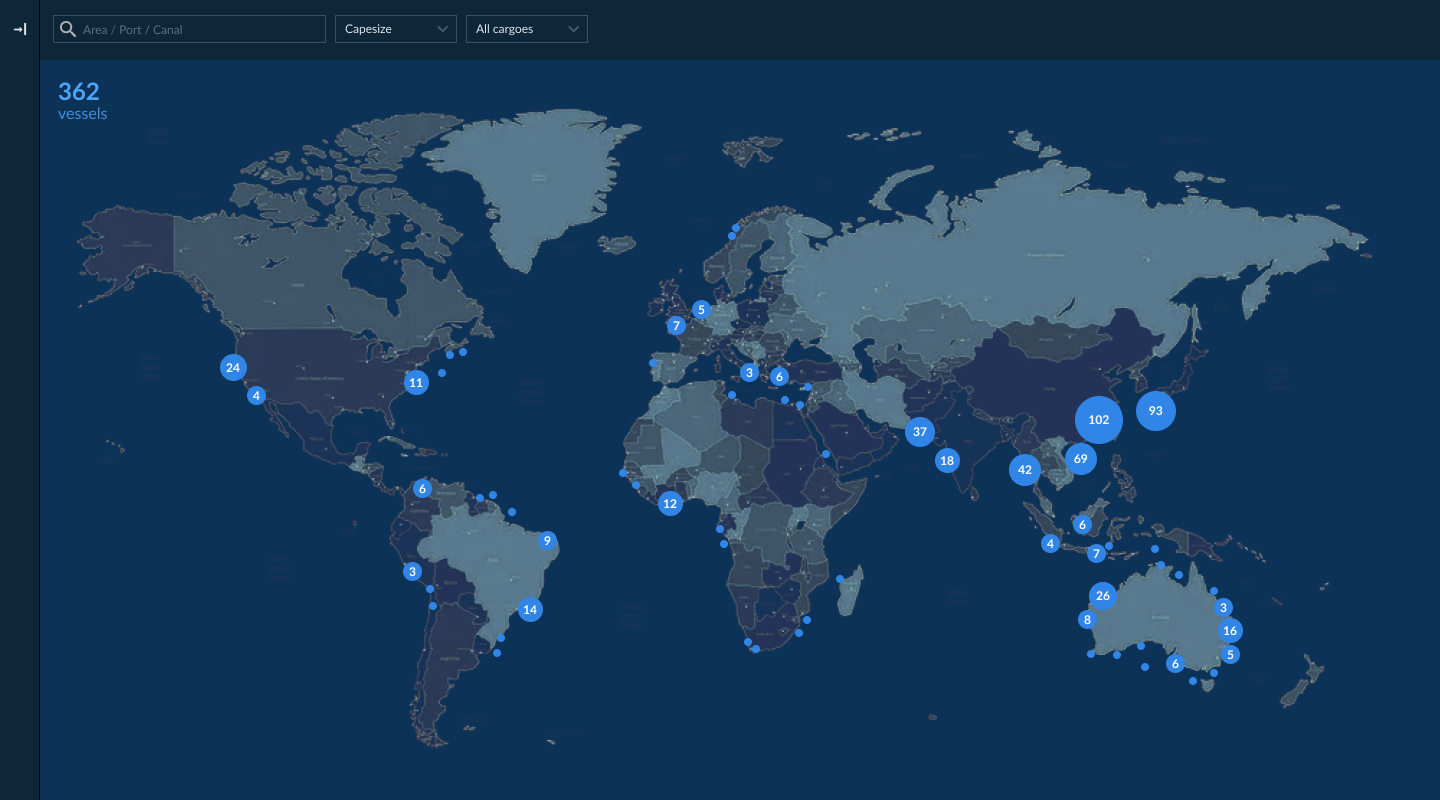
Signal Ocean platform is a pioneering maritime SaaS product that empowers data-driven decision-making for charterers, brokers and vessel owners. It combines both public and personal from multiples sources and transforms them into clear, actionable insights. That includes vessel locations, historical routes, fixings and reports as well as port specific details.
Challenge:
The main project I worked on focused on the reports area. At the time, the platform had around 50 heavy data reports, which were all inconsistent, lacking structure and usability. My task was to review the reports in terms for IA and usability, and create a consistent structure that would enable users to easily create new reports using a template solution and given guidelines to ensure best use of the data.
Approach
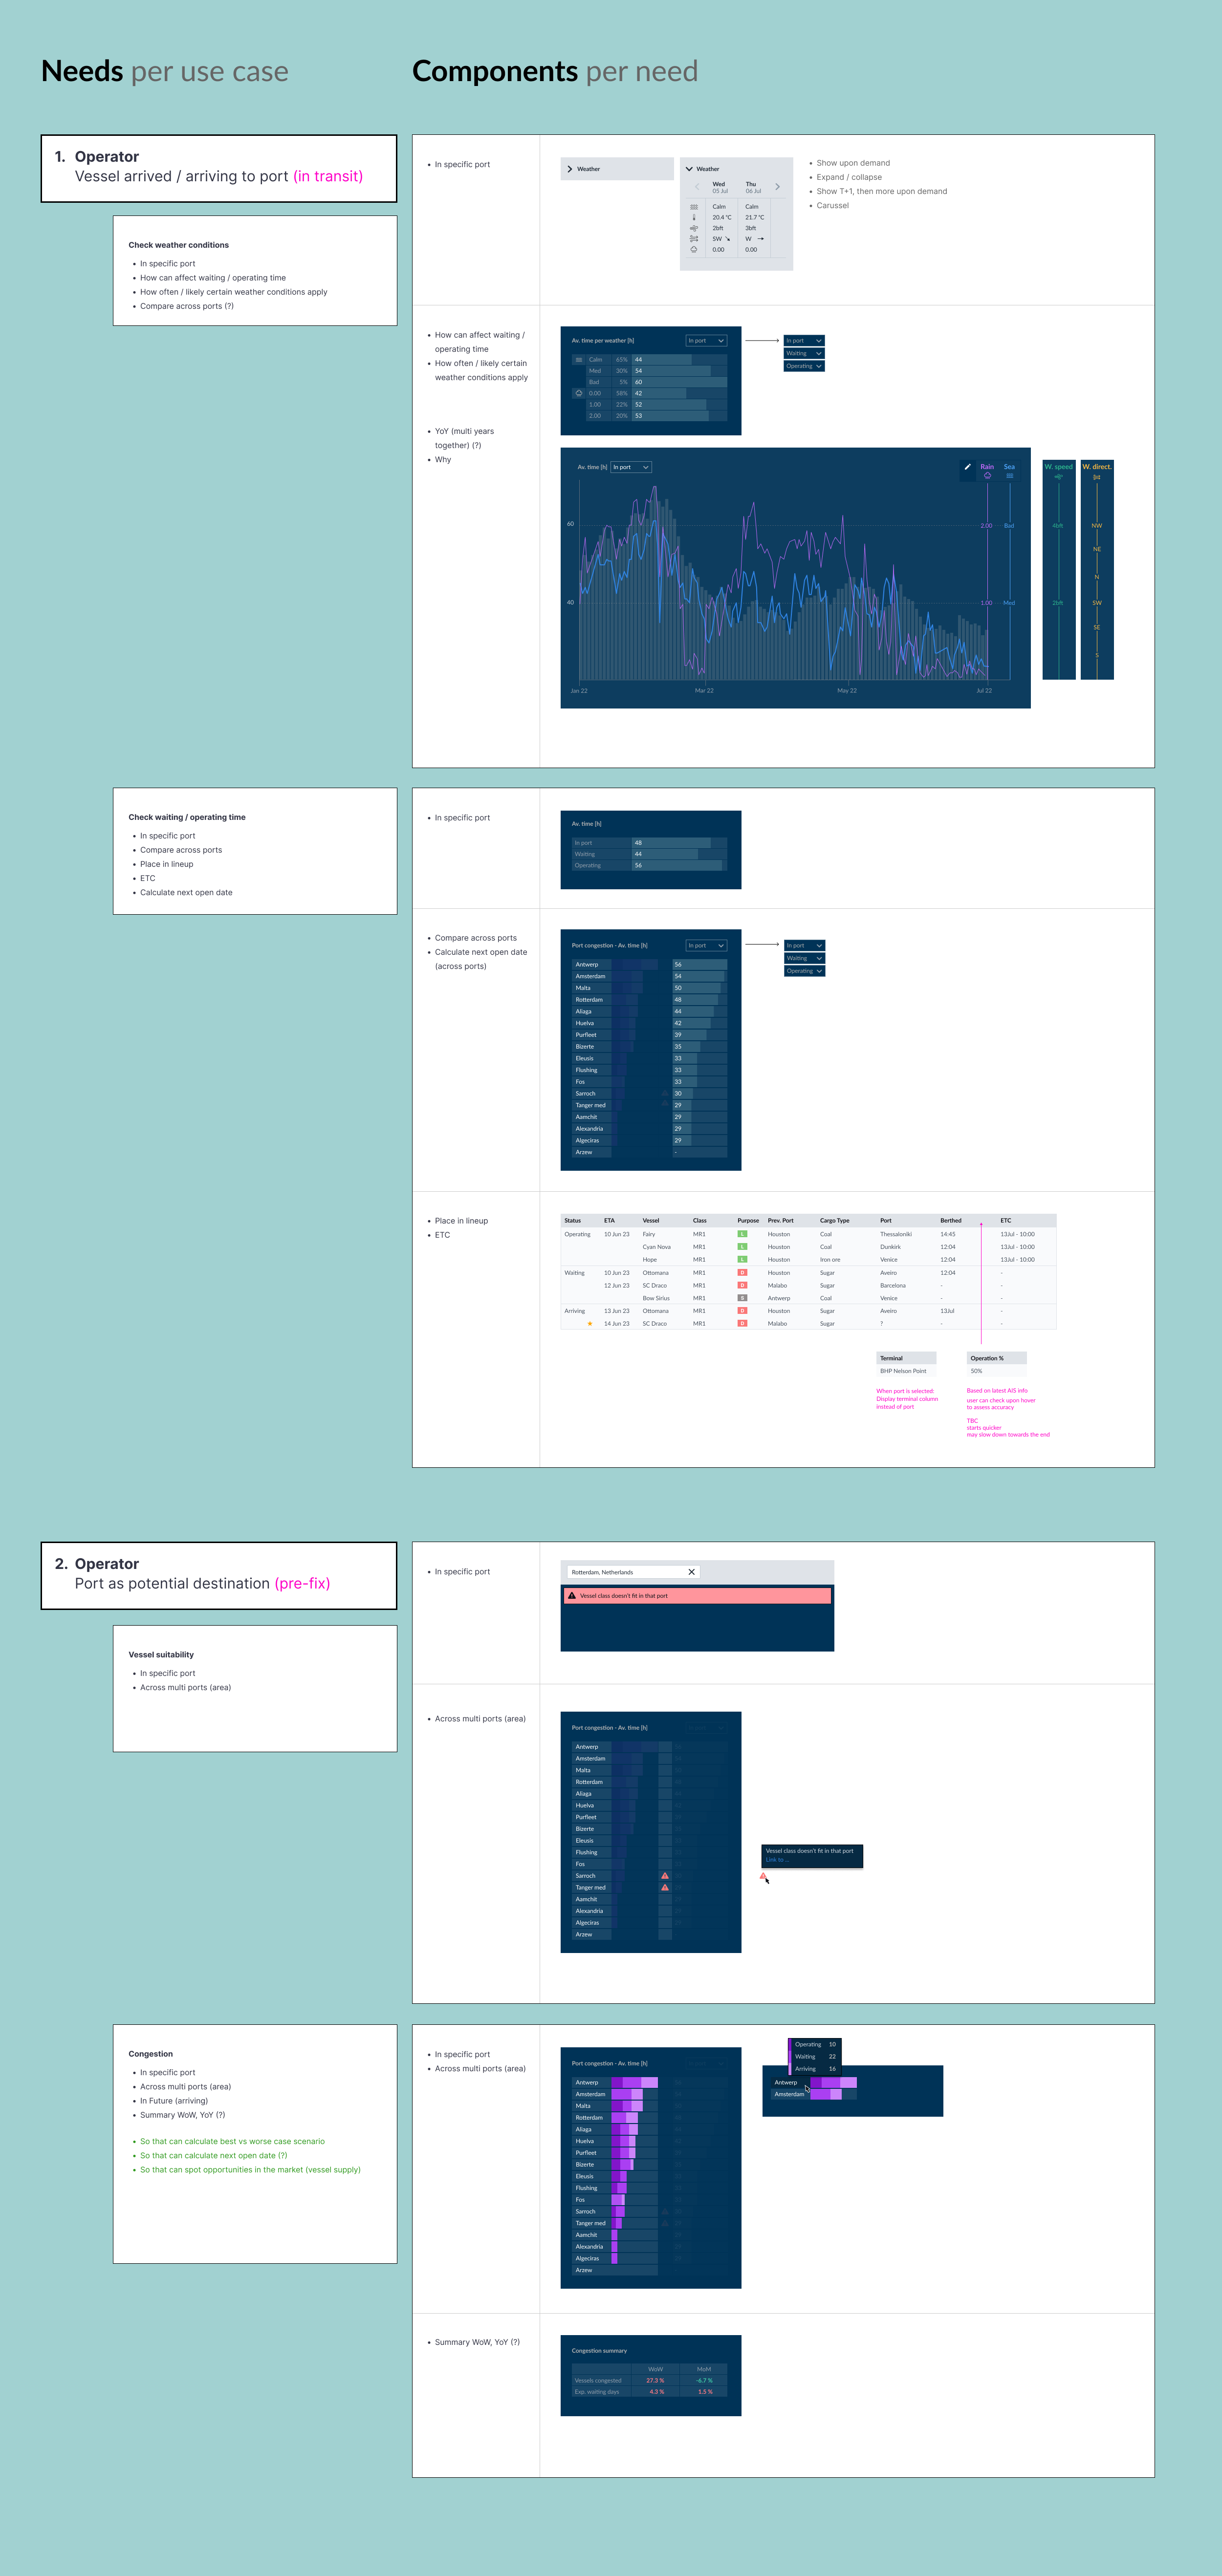
We decided to start with Port insights and Congestions reports as they were used the most and also shared similar needs and components between them. Since I was new to the maritime industry, the first steps were to understand the Journey with its subsets (pre – during – post fix) and steps within each, together with the Actors involved. This helped in defining the needs and connect them to components and sections within the reports.
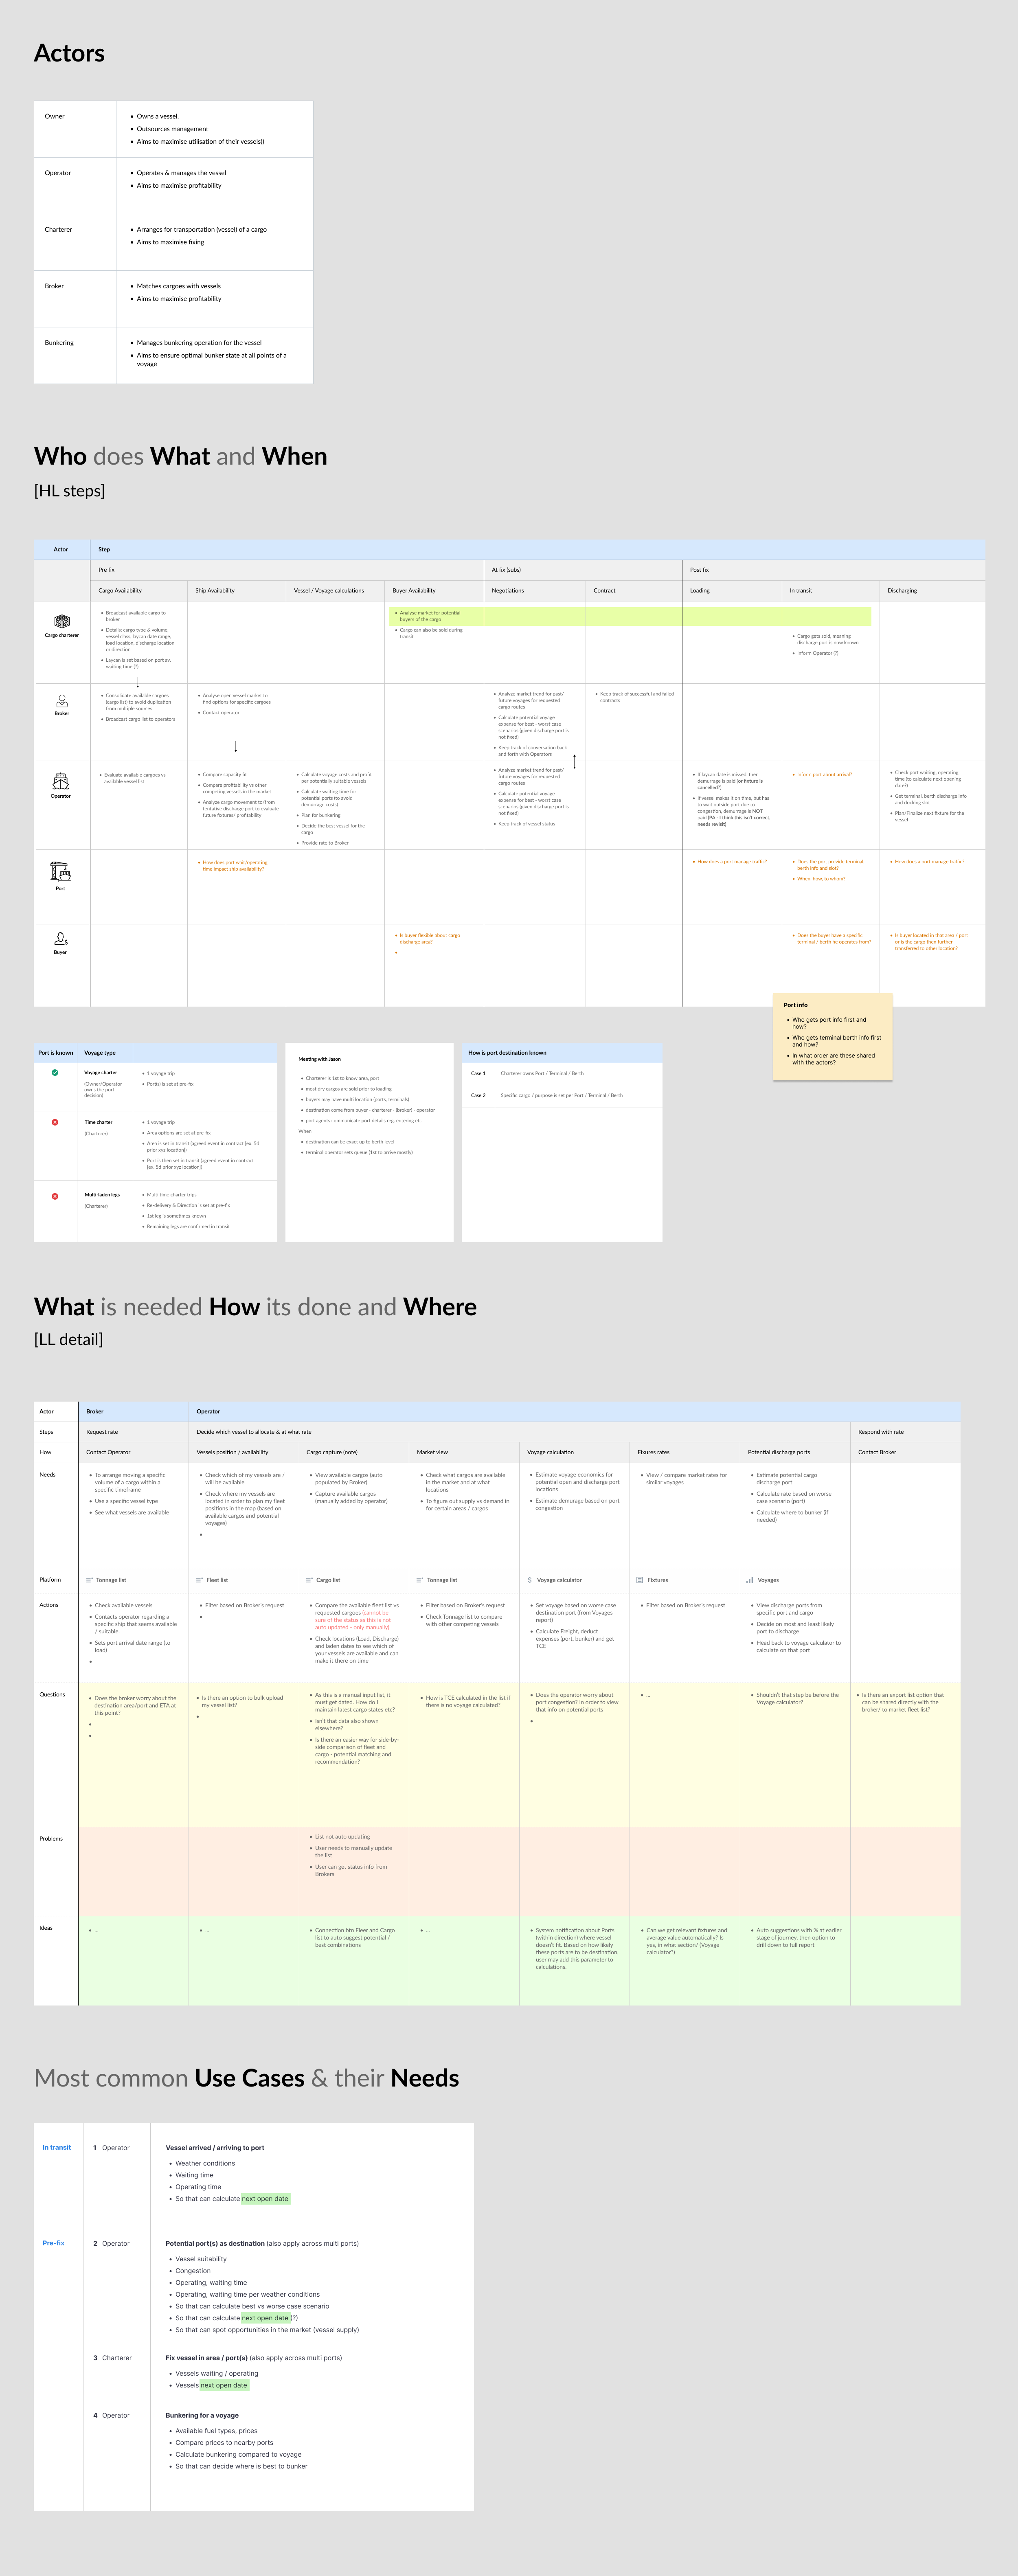
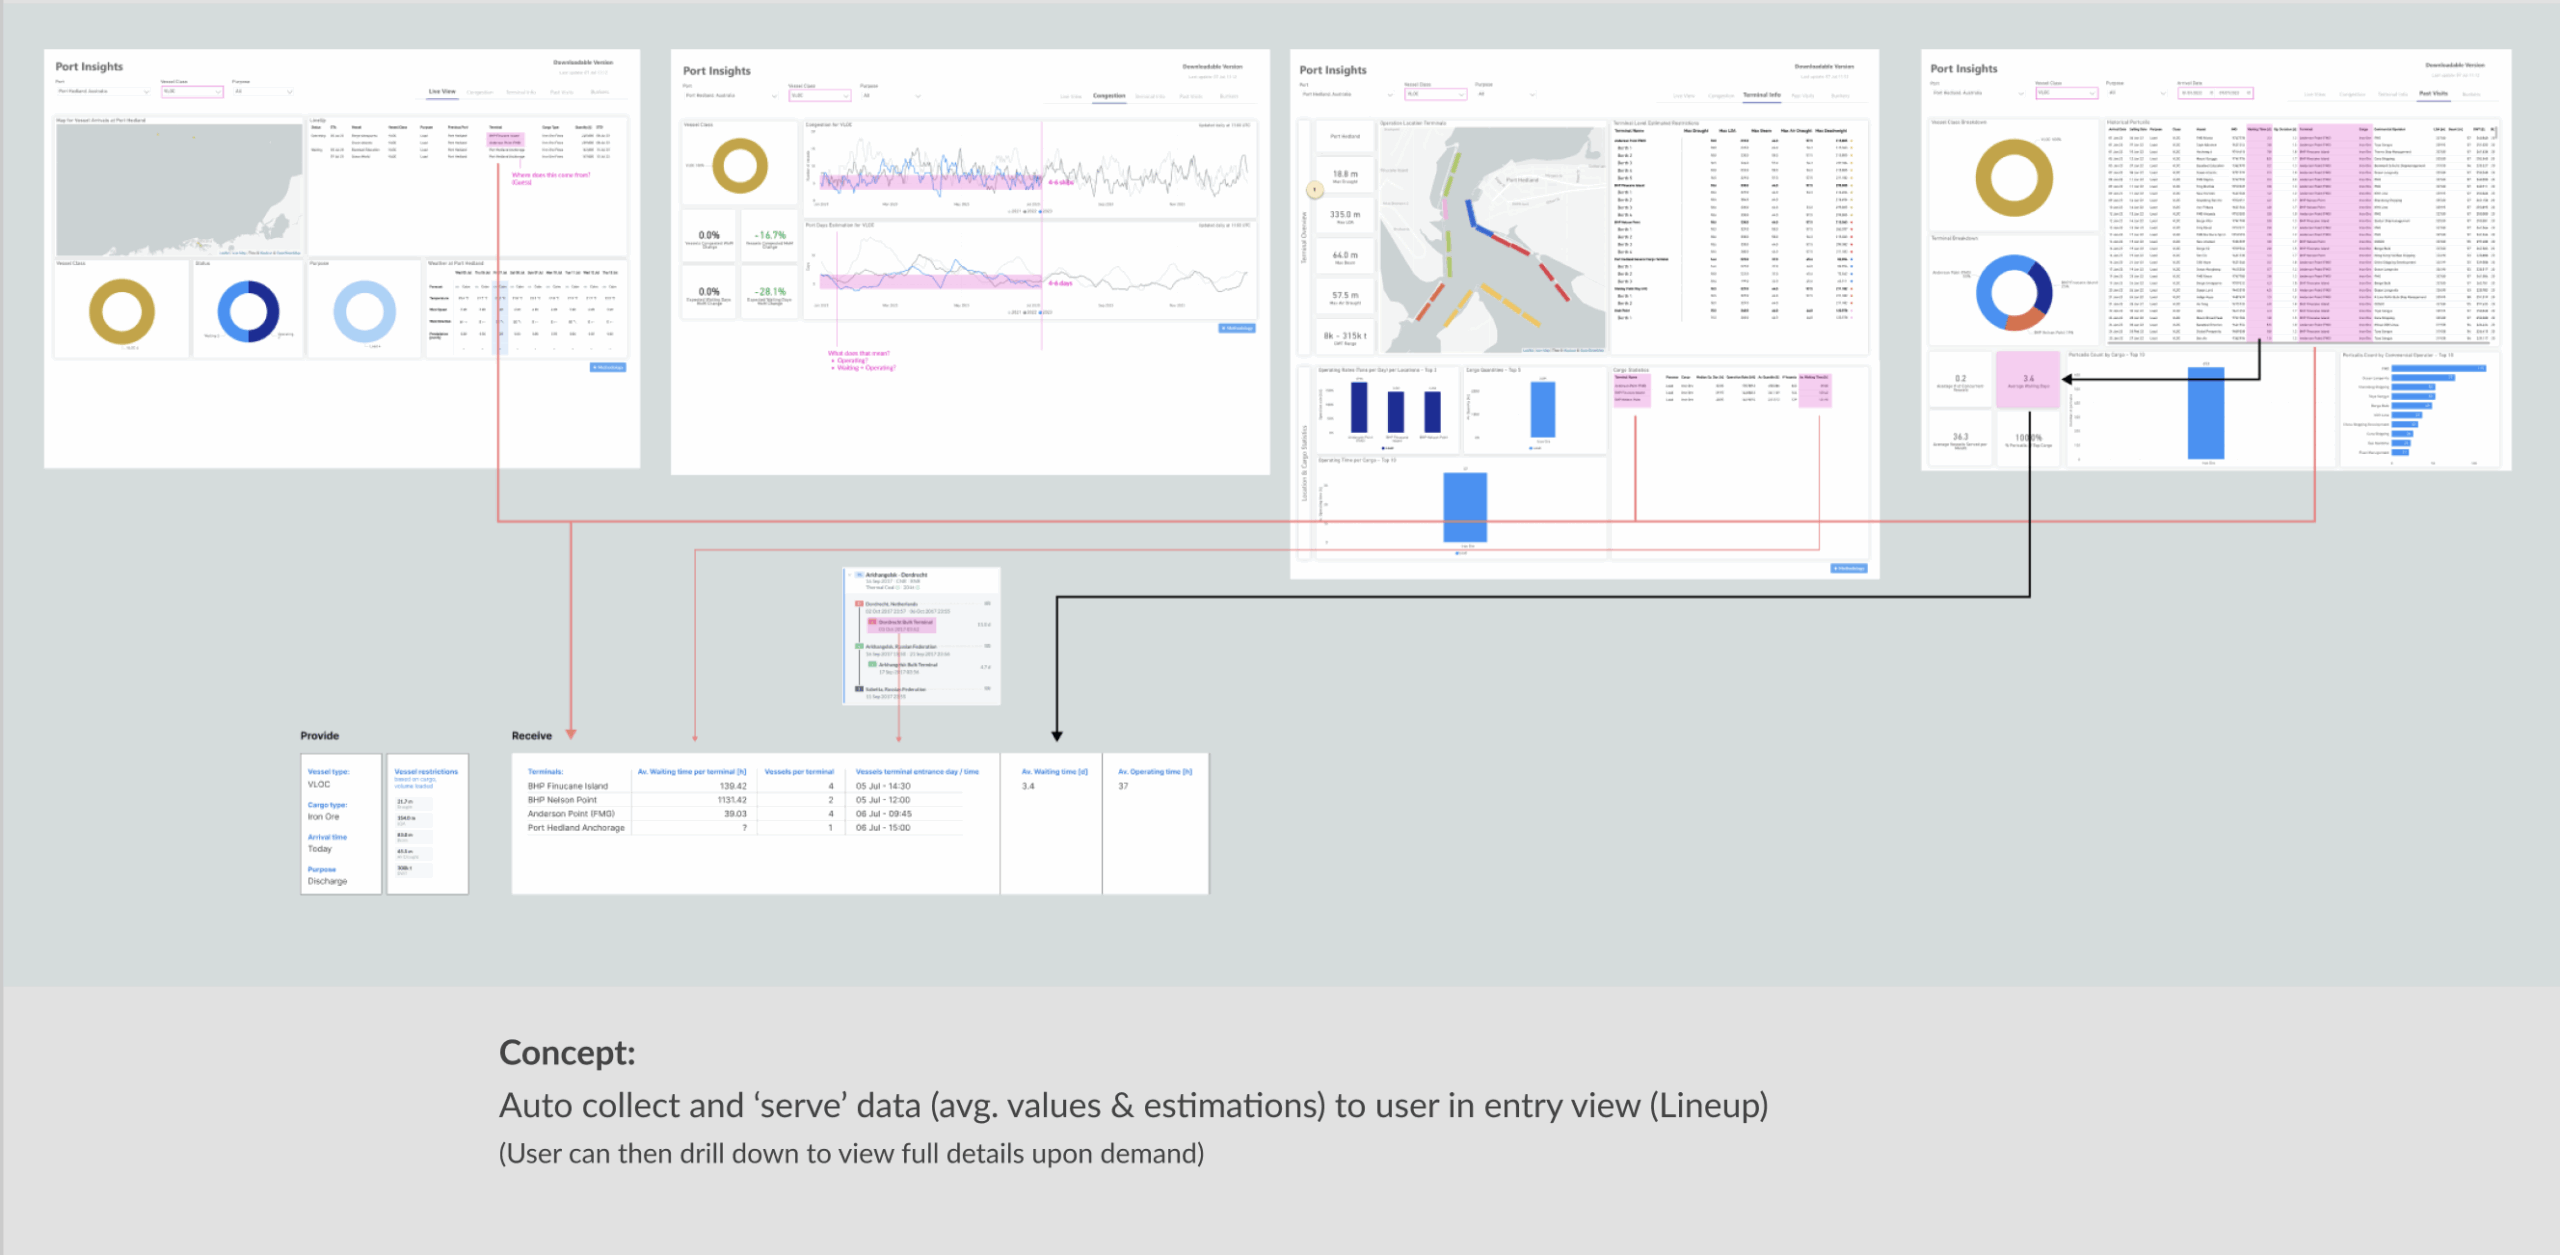
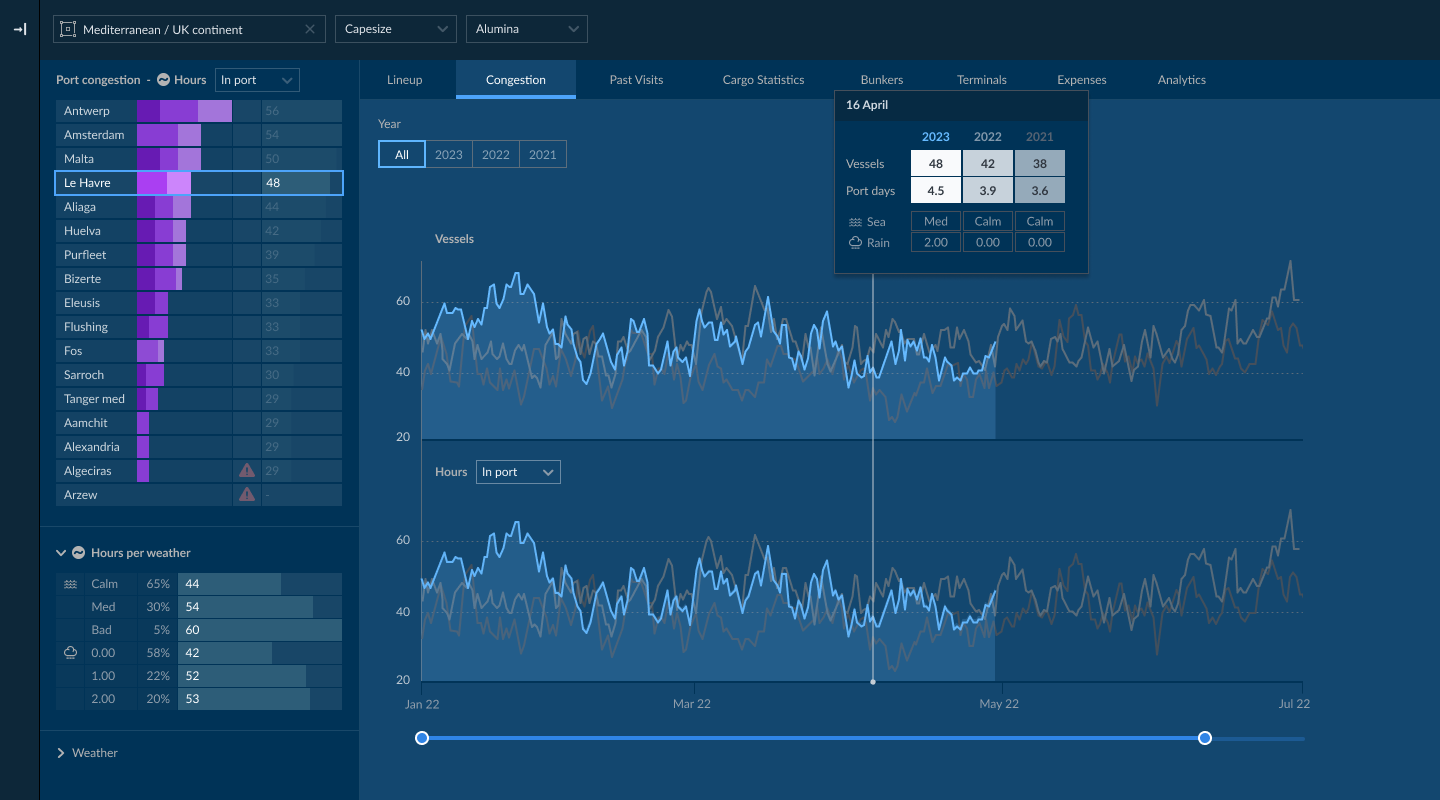
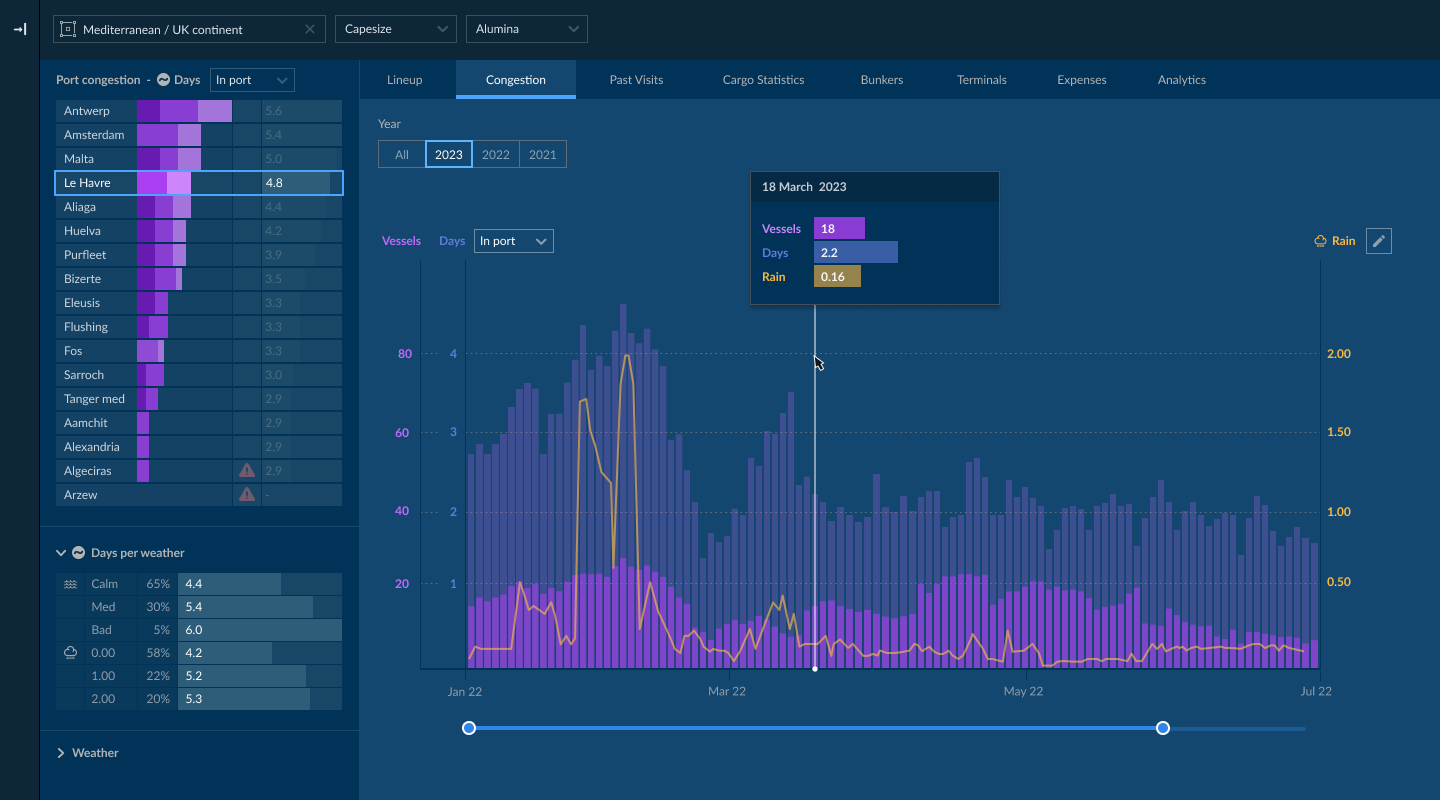
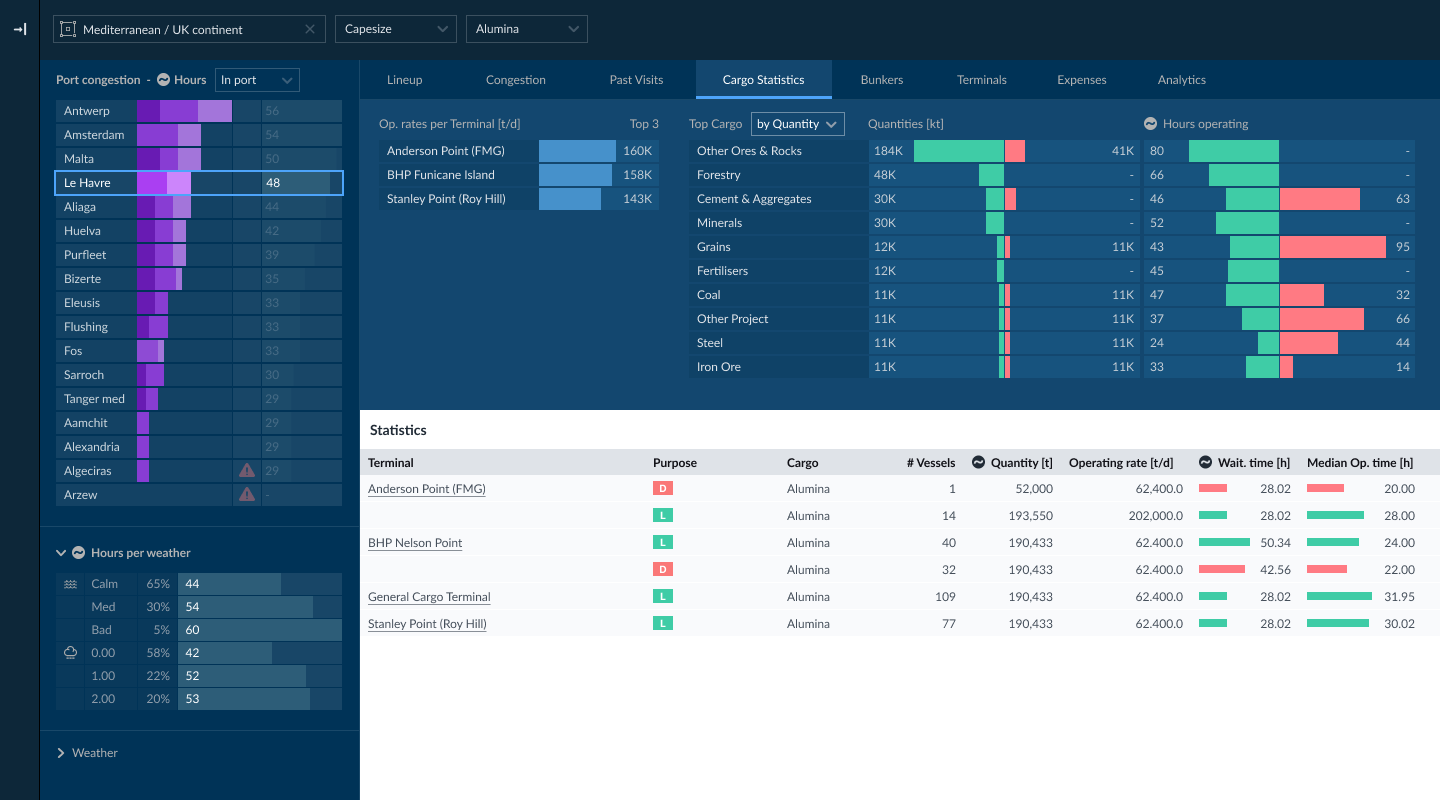
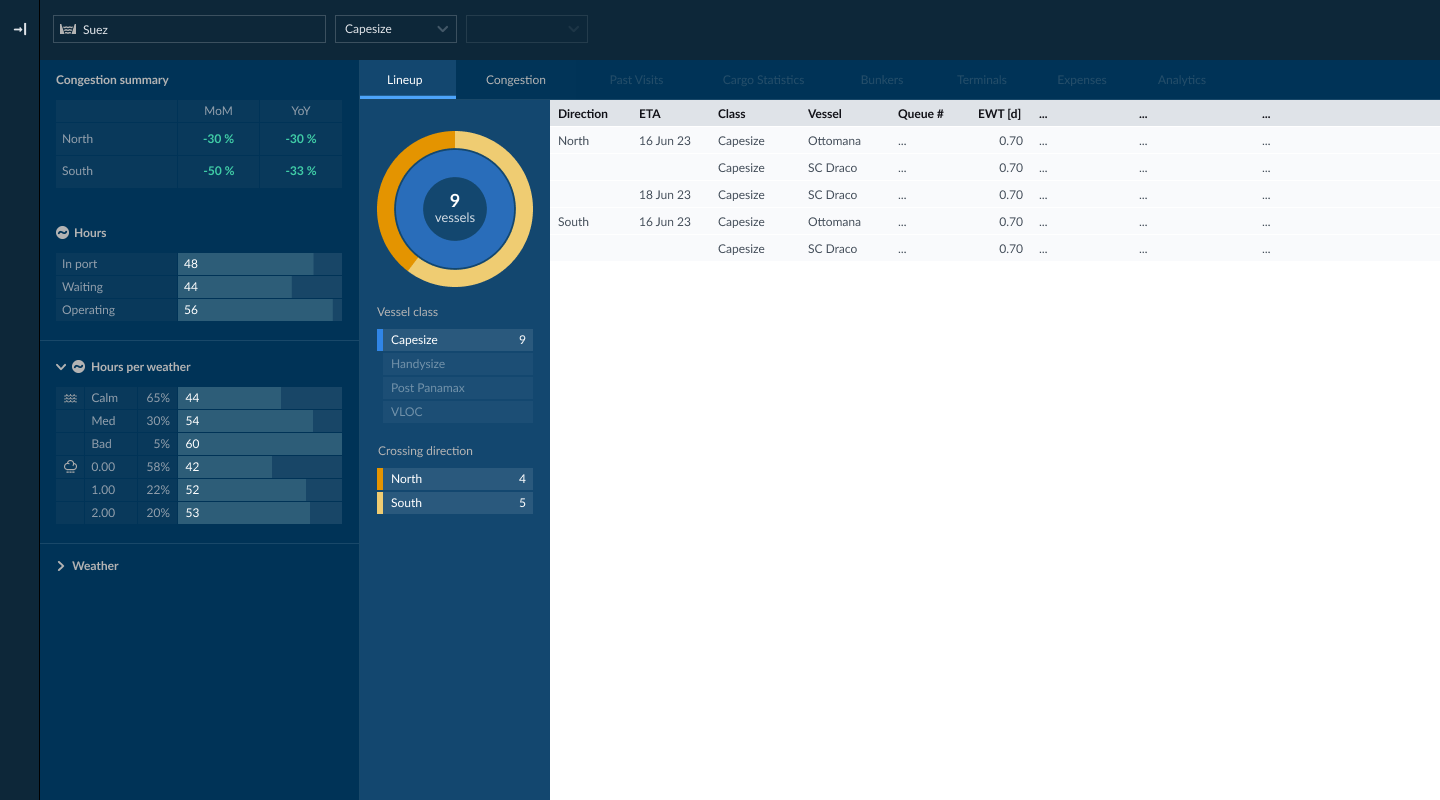
Once knowing the core needs per use case, I found out that all the necessary information was available, but spread out within multiple sections of the report. This way the user had to manually gather all the data in order to make a decision. It became even more challenging when users needed to compare information of multiple ports within an area.
Exploring new solutions
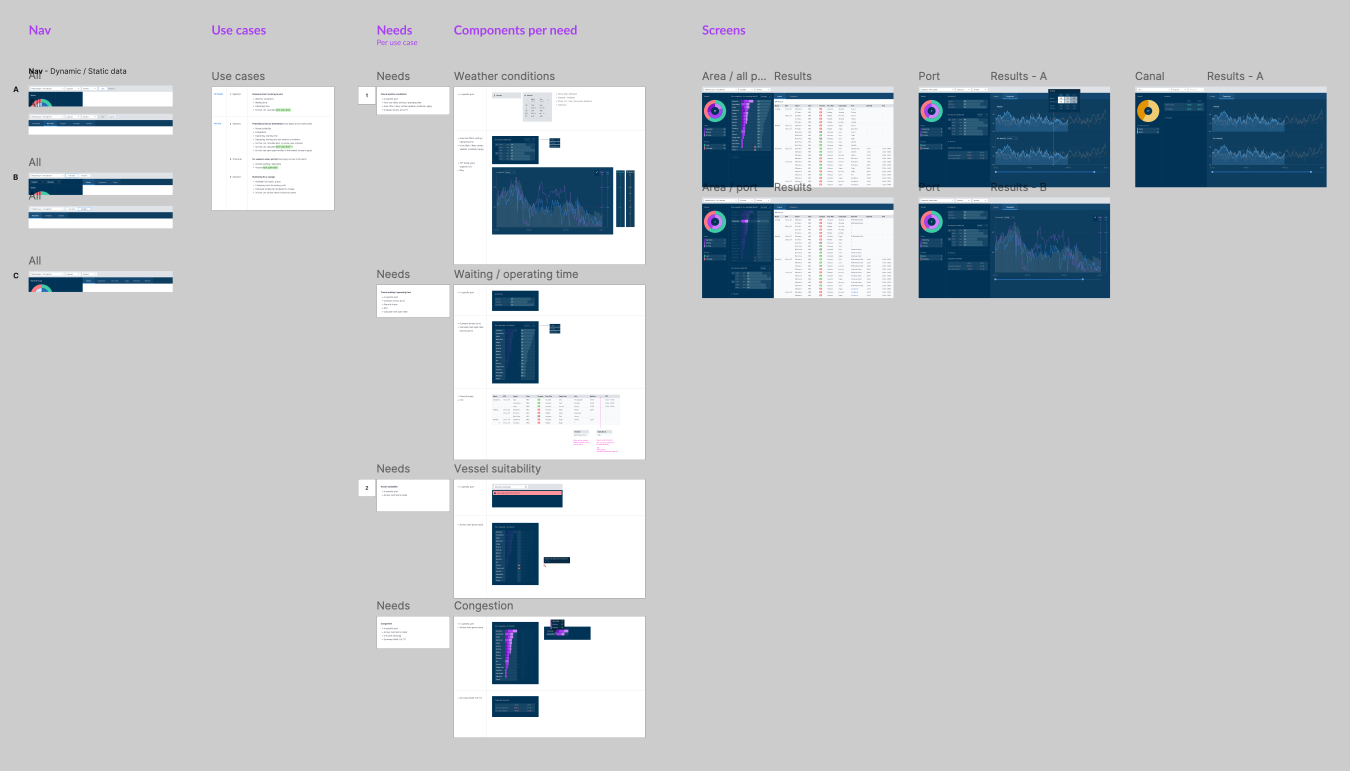
To cover the needs per use cases, I created new components as well as edited existing ones, together with correcting key structural elements such as navigation and filtering.
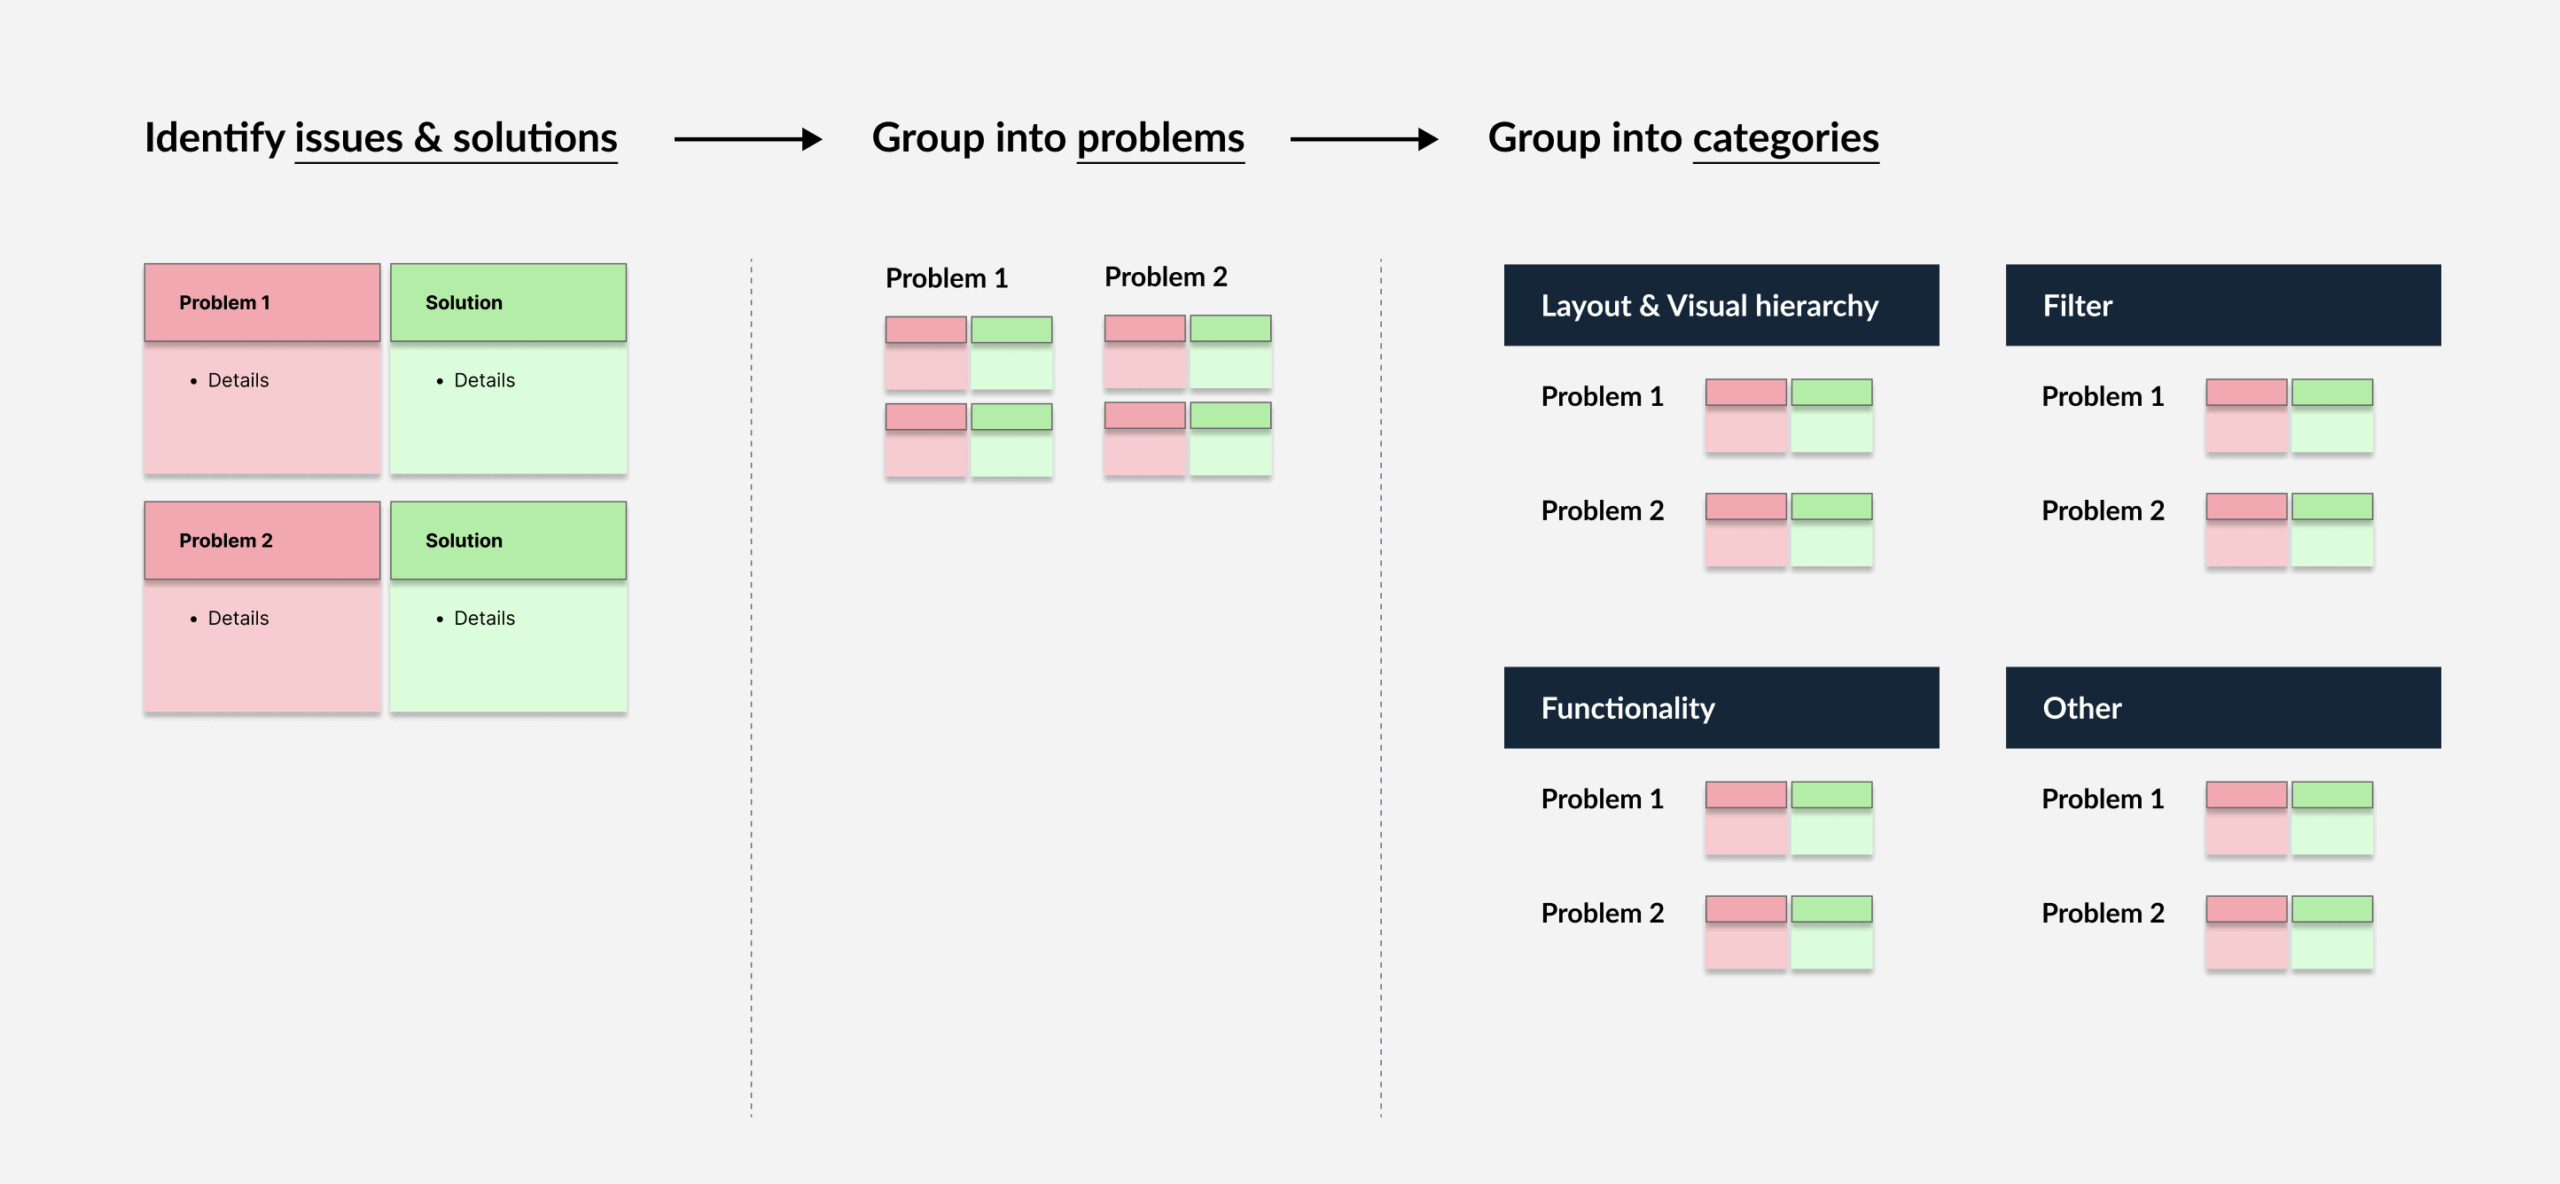
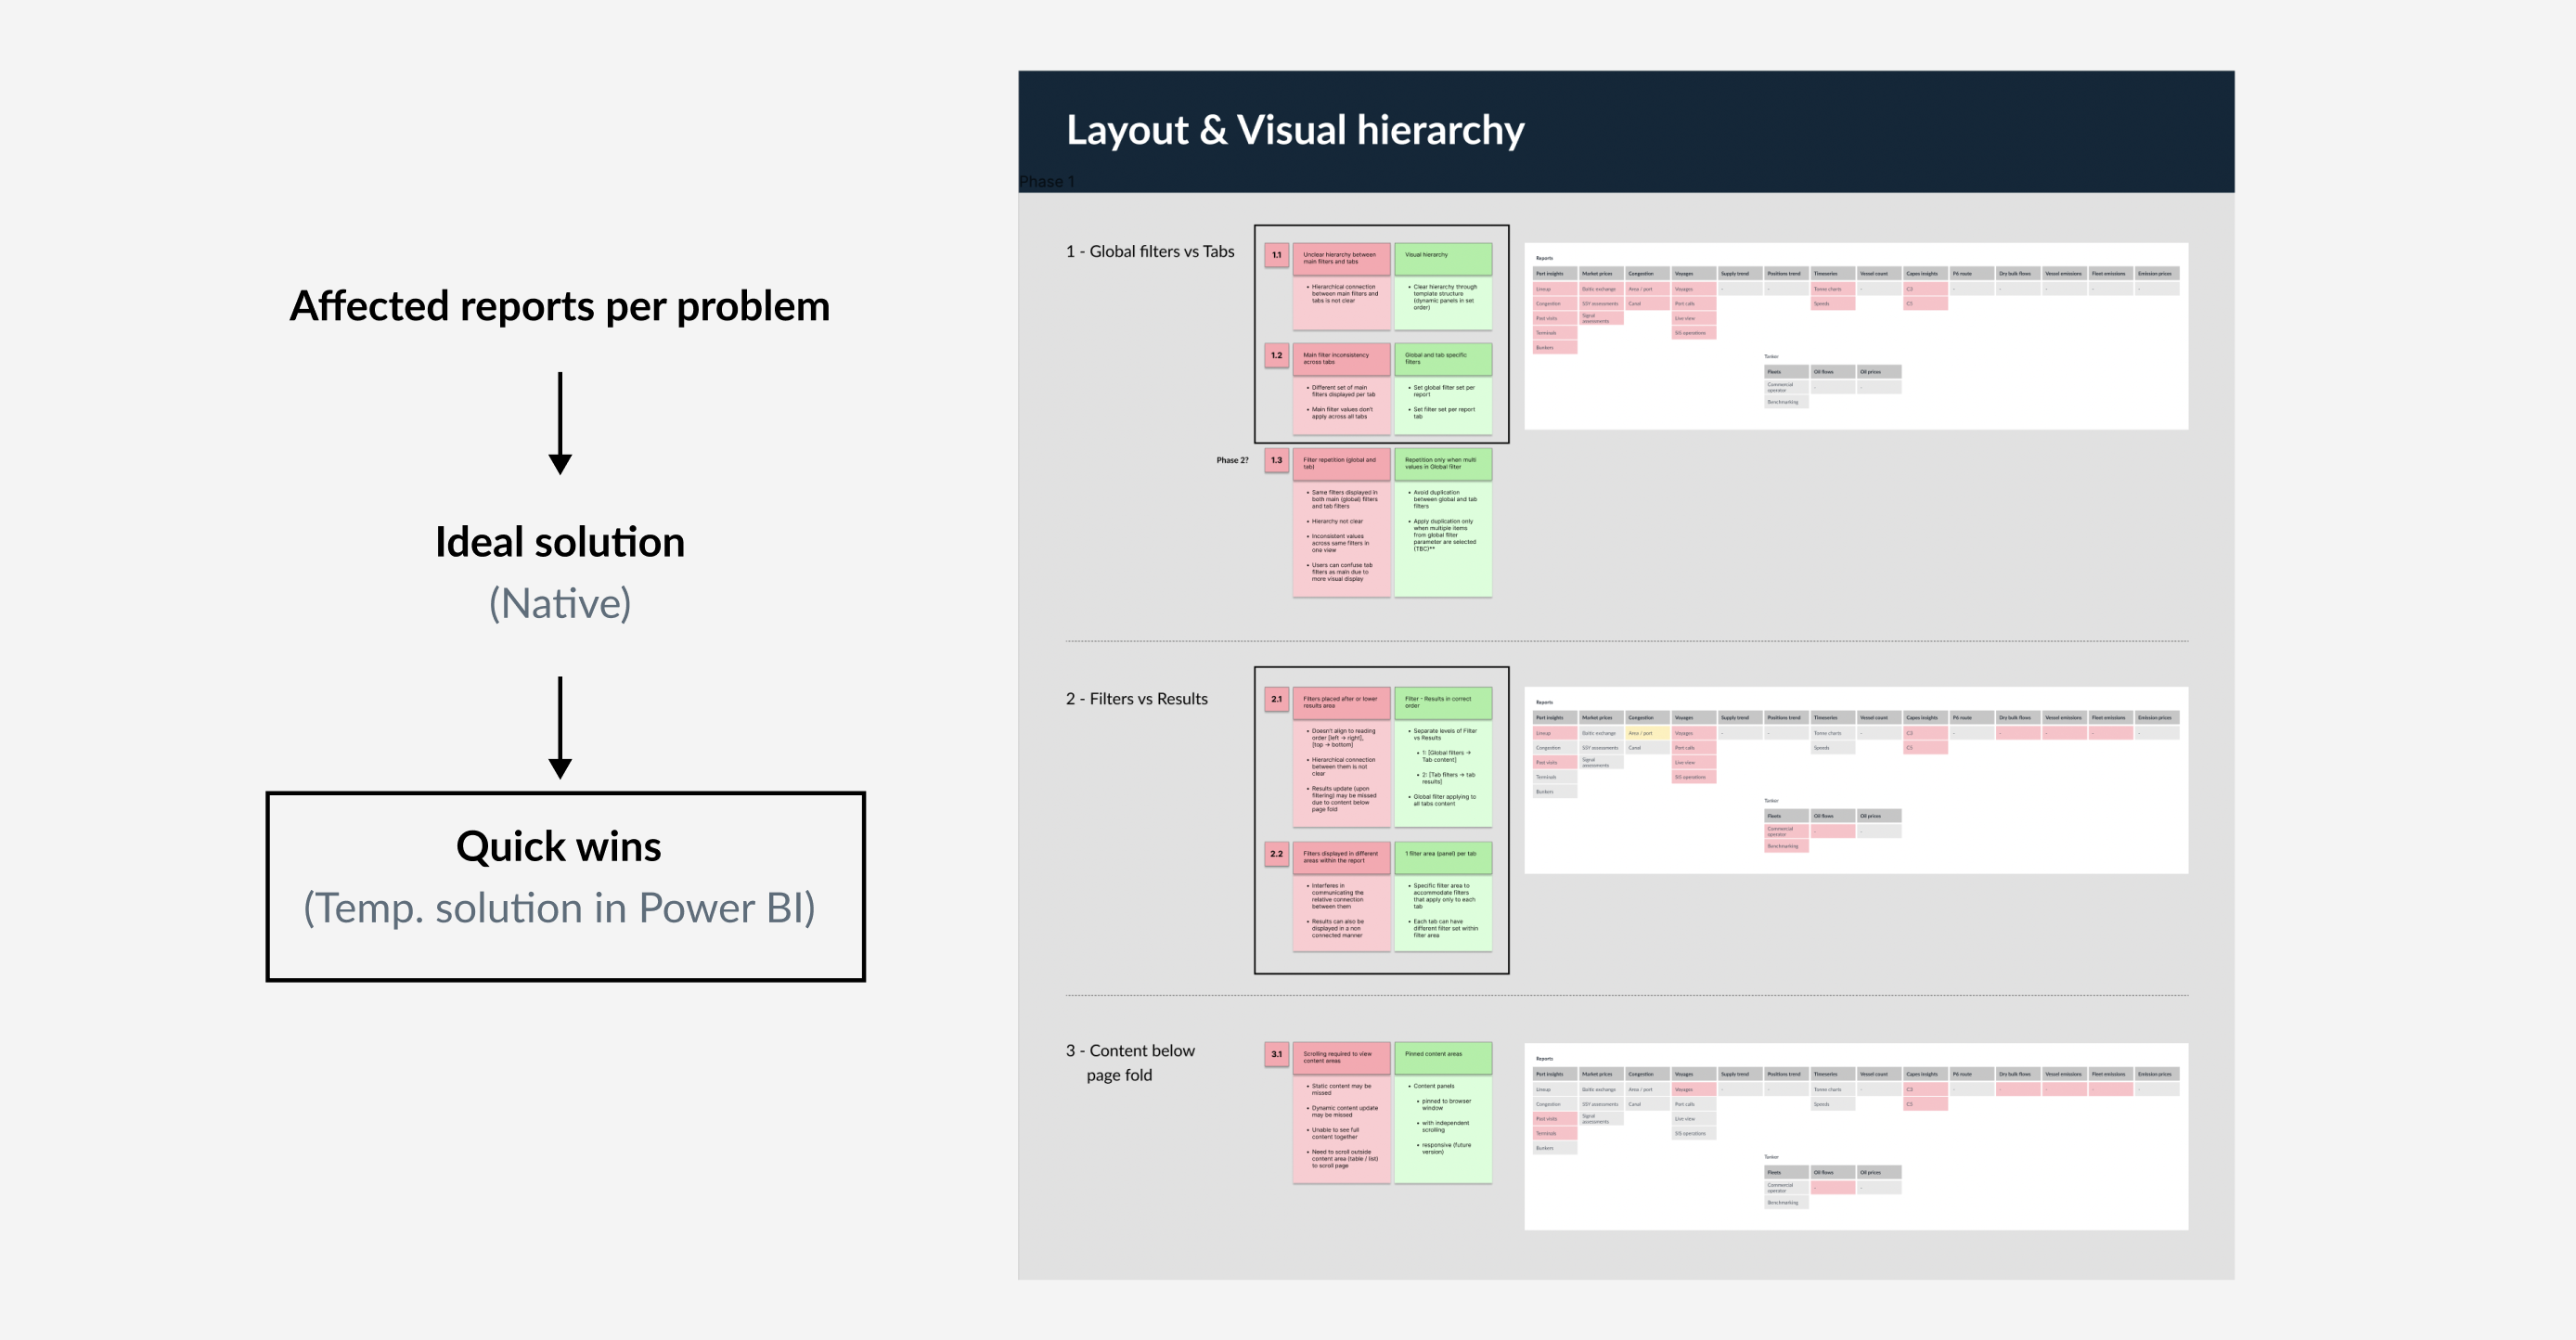
Assessing current structure
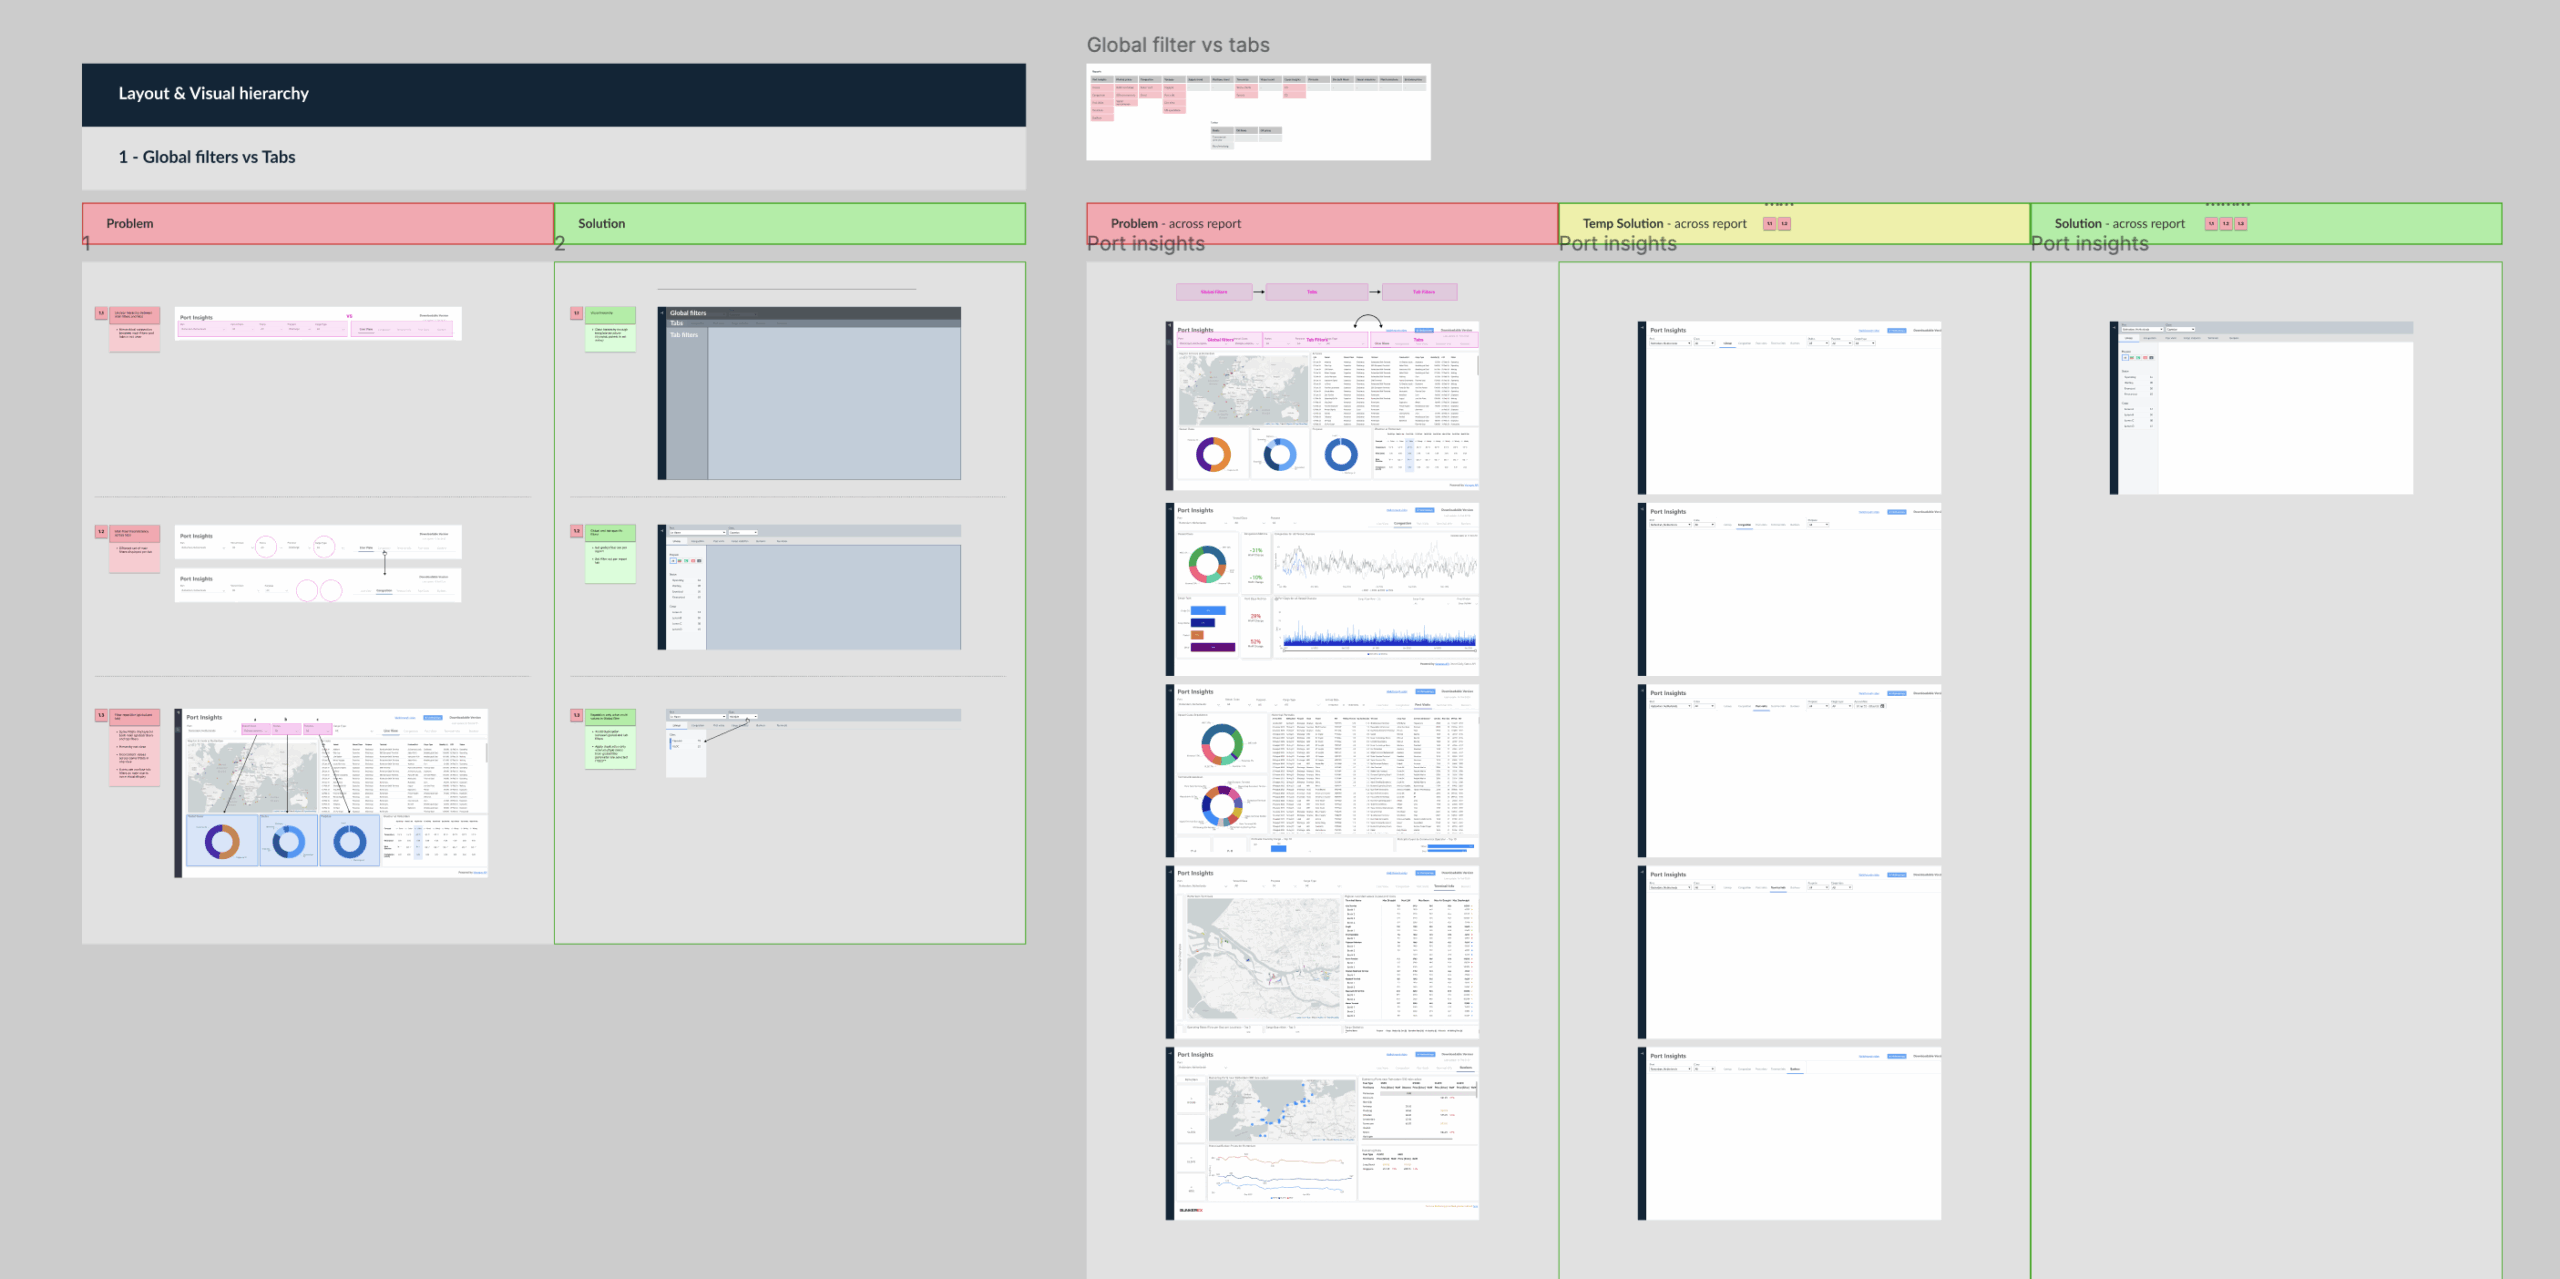
At the same time an initial review of the current structure was performed in order to understand and communicate structural flaws from a component interaction and visual hierarchy point of view. This was put together in a form of report to ensure it effectively communicated the severity, by pointing out which reports are affected per issue. Moreover there a solution was provided per issue
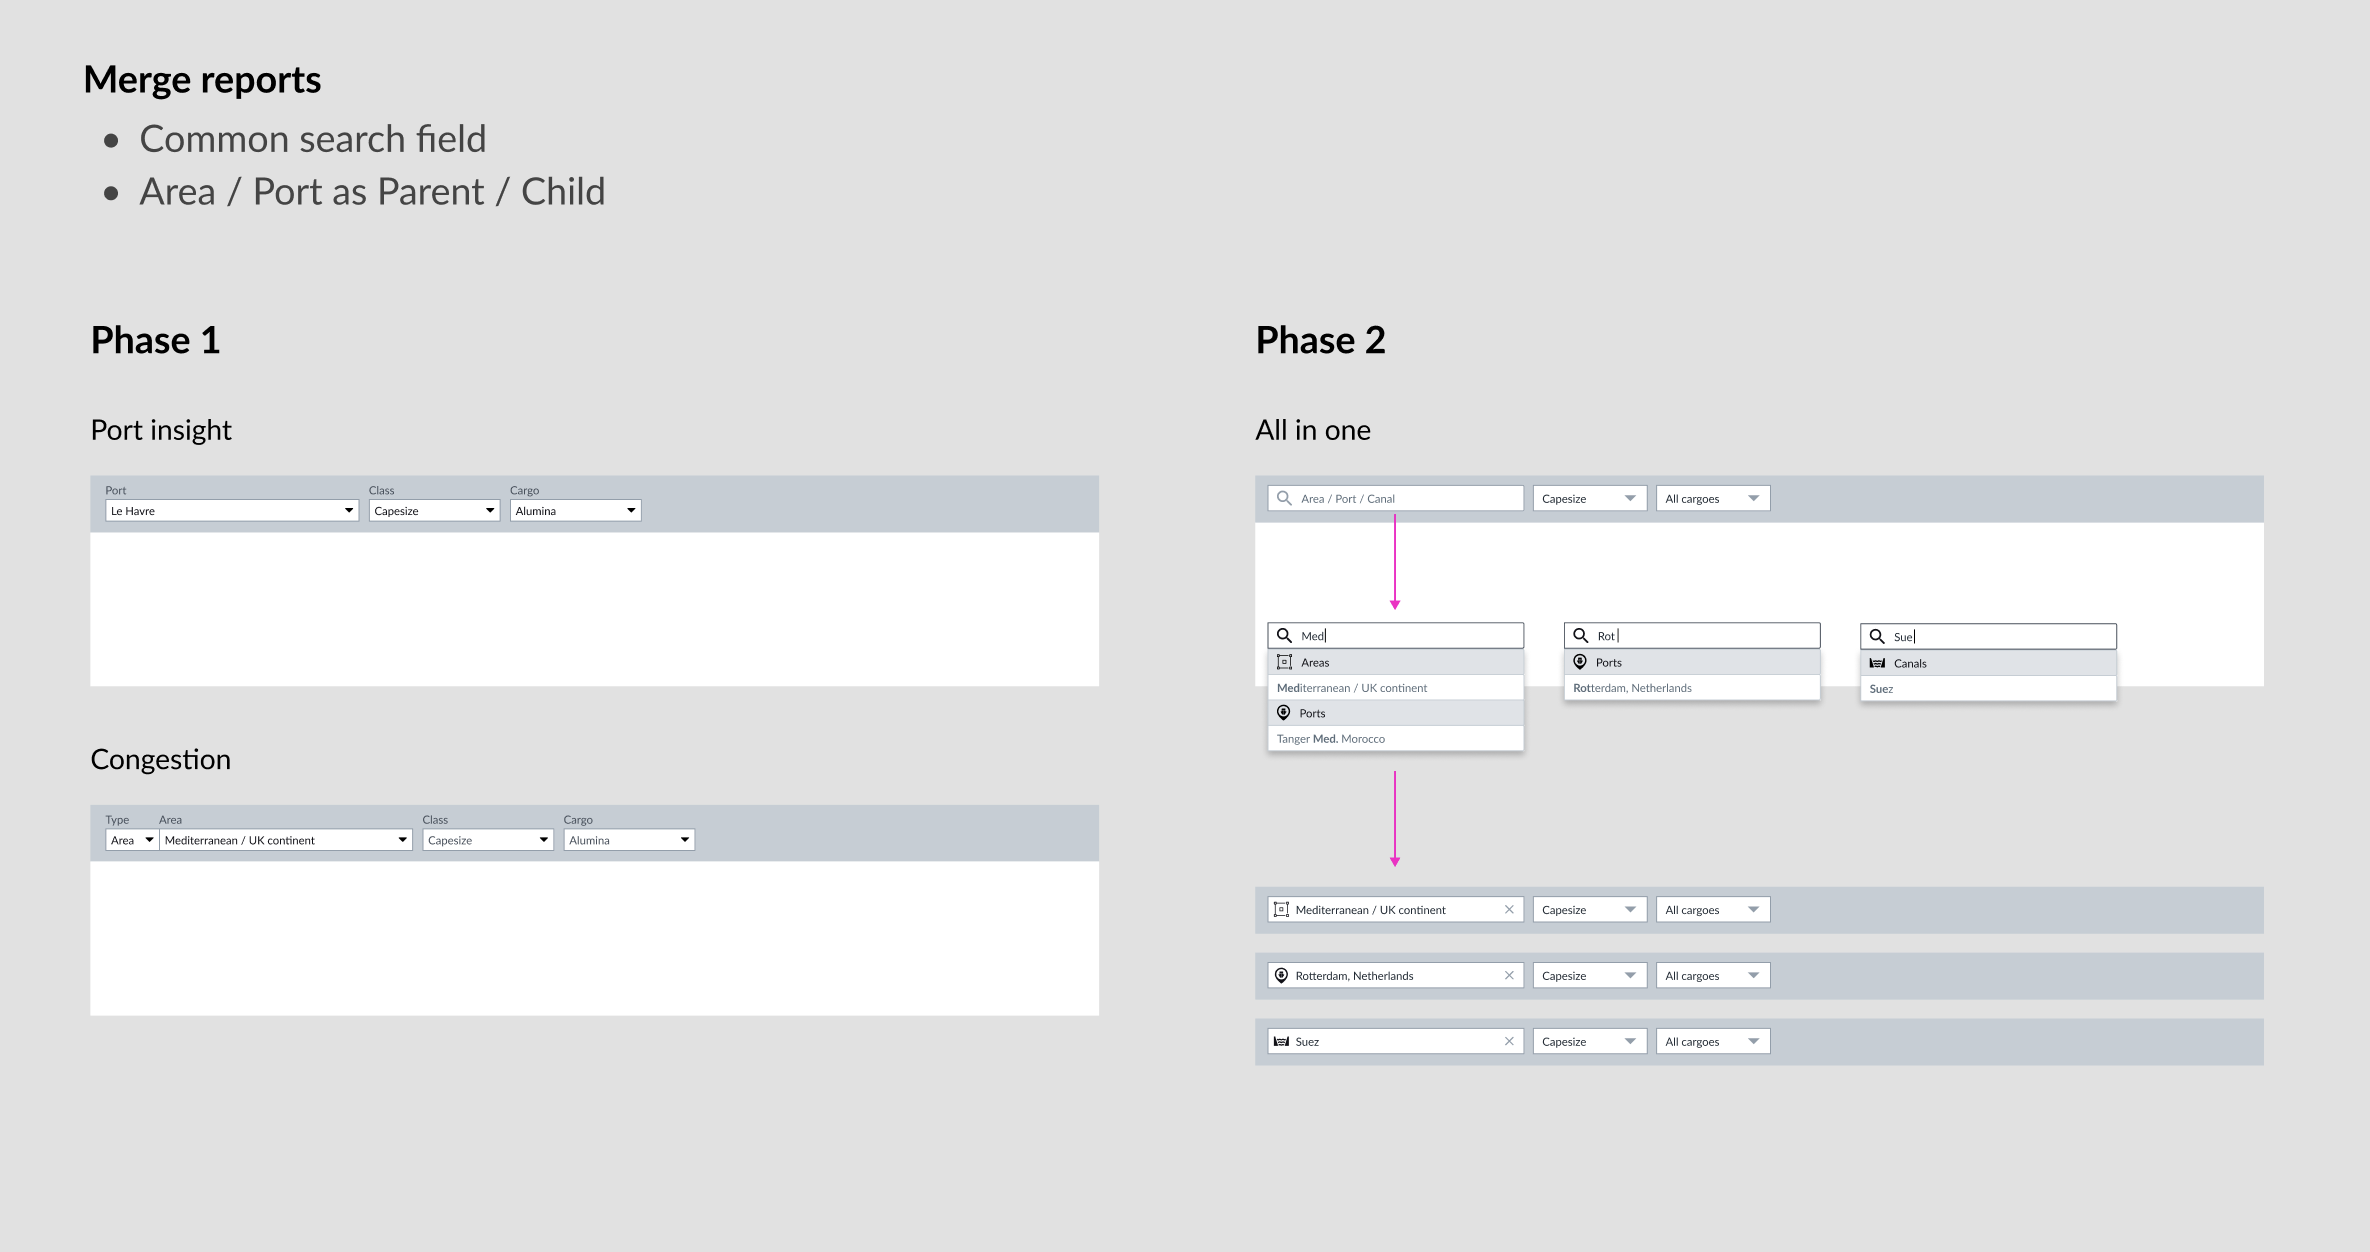
Merging reports
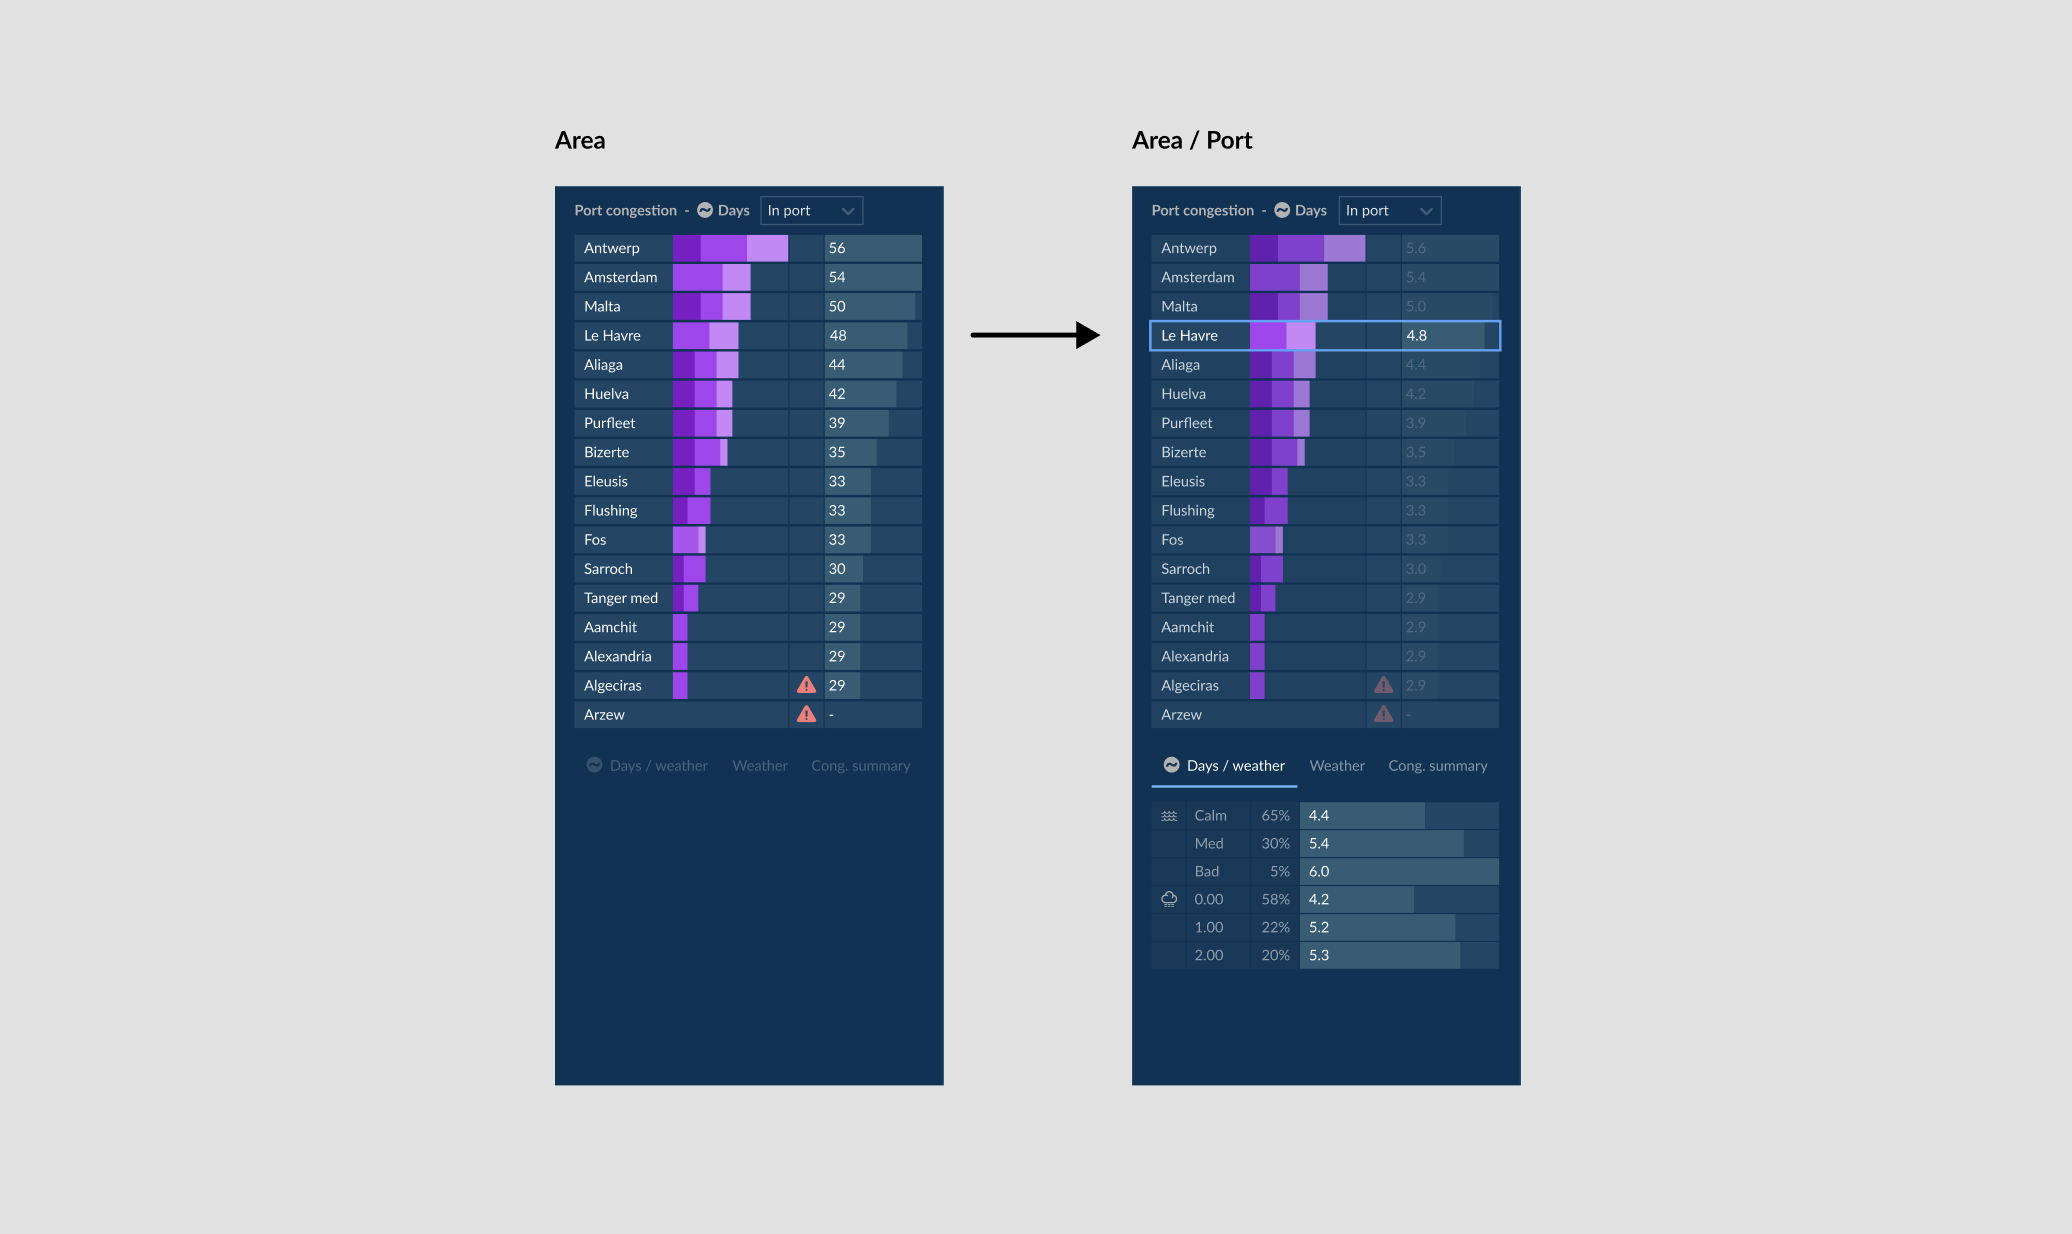
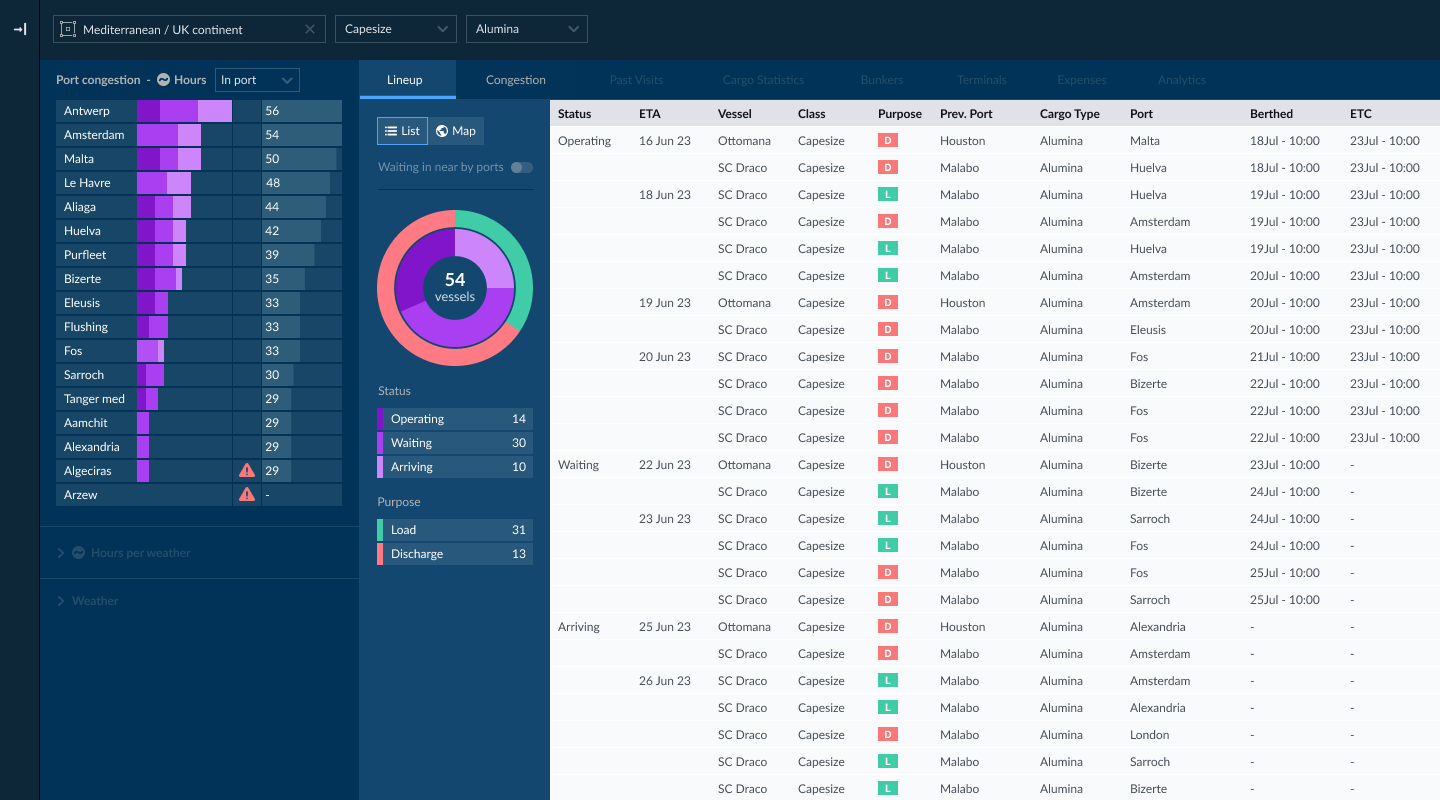
At that stage is was clear that the correct direction was to merge the 3 reports (Area, Port, Canal) primarily because Ports are subsets of an Area, and also as all 3 reports share common needs and therefore components. That was allowing search/selection of all 3 types and lated by displaying a Ports menu for Areas.
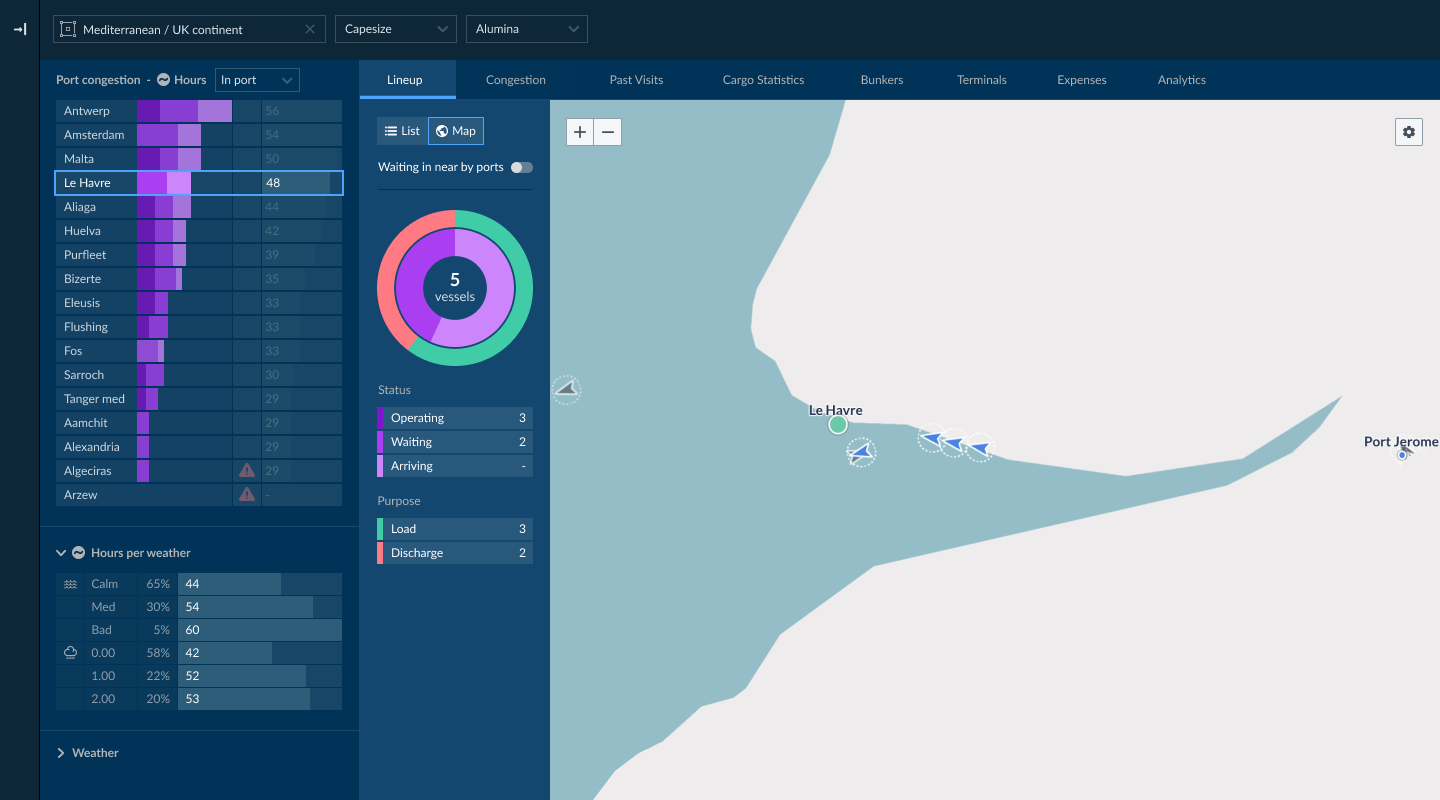
This way users can go directly into a Port, or go there via an Area, which provides additional advantage of comparing data across Ports of the same Area. That covered a very important need, as Charterers don’t necessarily know the final destination (Port) of a potential fixing and need to calculate best vs worse case scenario by comparing multiple Ports data.
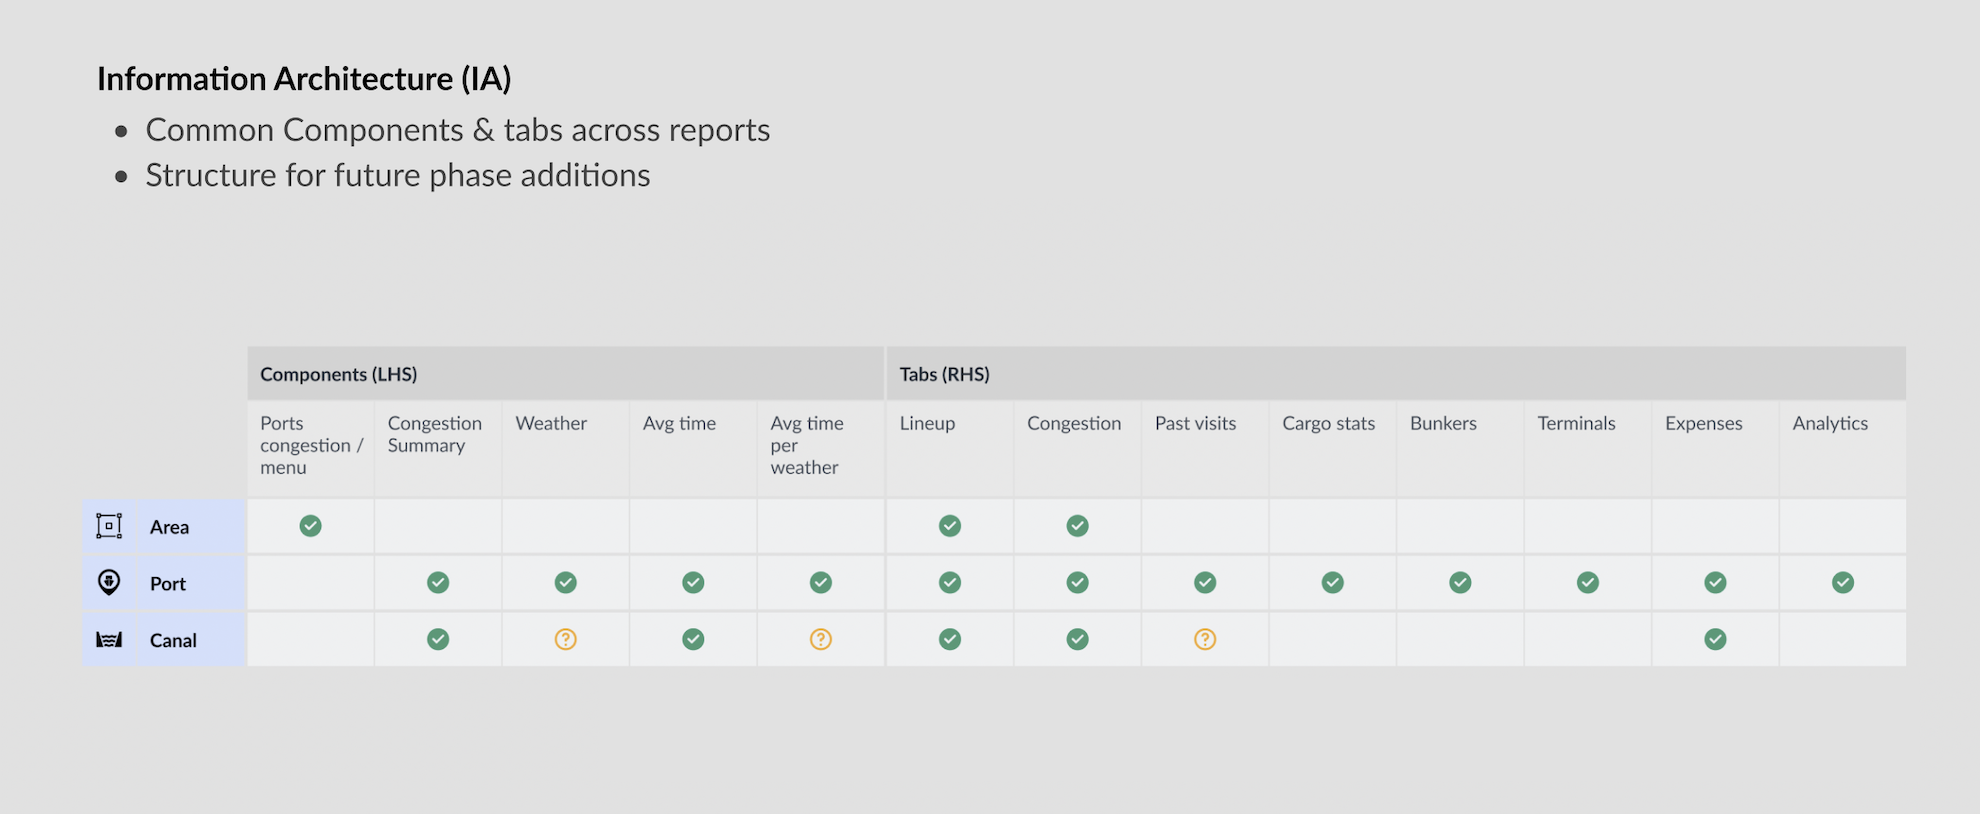
Report template
To ensure consistency across all reports, an adjustable template structure was formed, which consisted of dynamic frames is set hierarchical order. Components were then grouped by the need they served to be used in certain frames as a common pattern across all reports.
Some reports are simpler than others so they may not need the full set of frames. In that case they can use only a selection plus adjust the size if needed. Either way the hierarchical order is always preserved within any template variation.

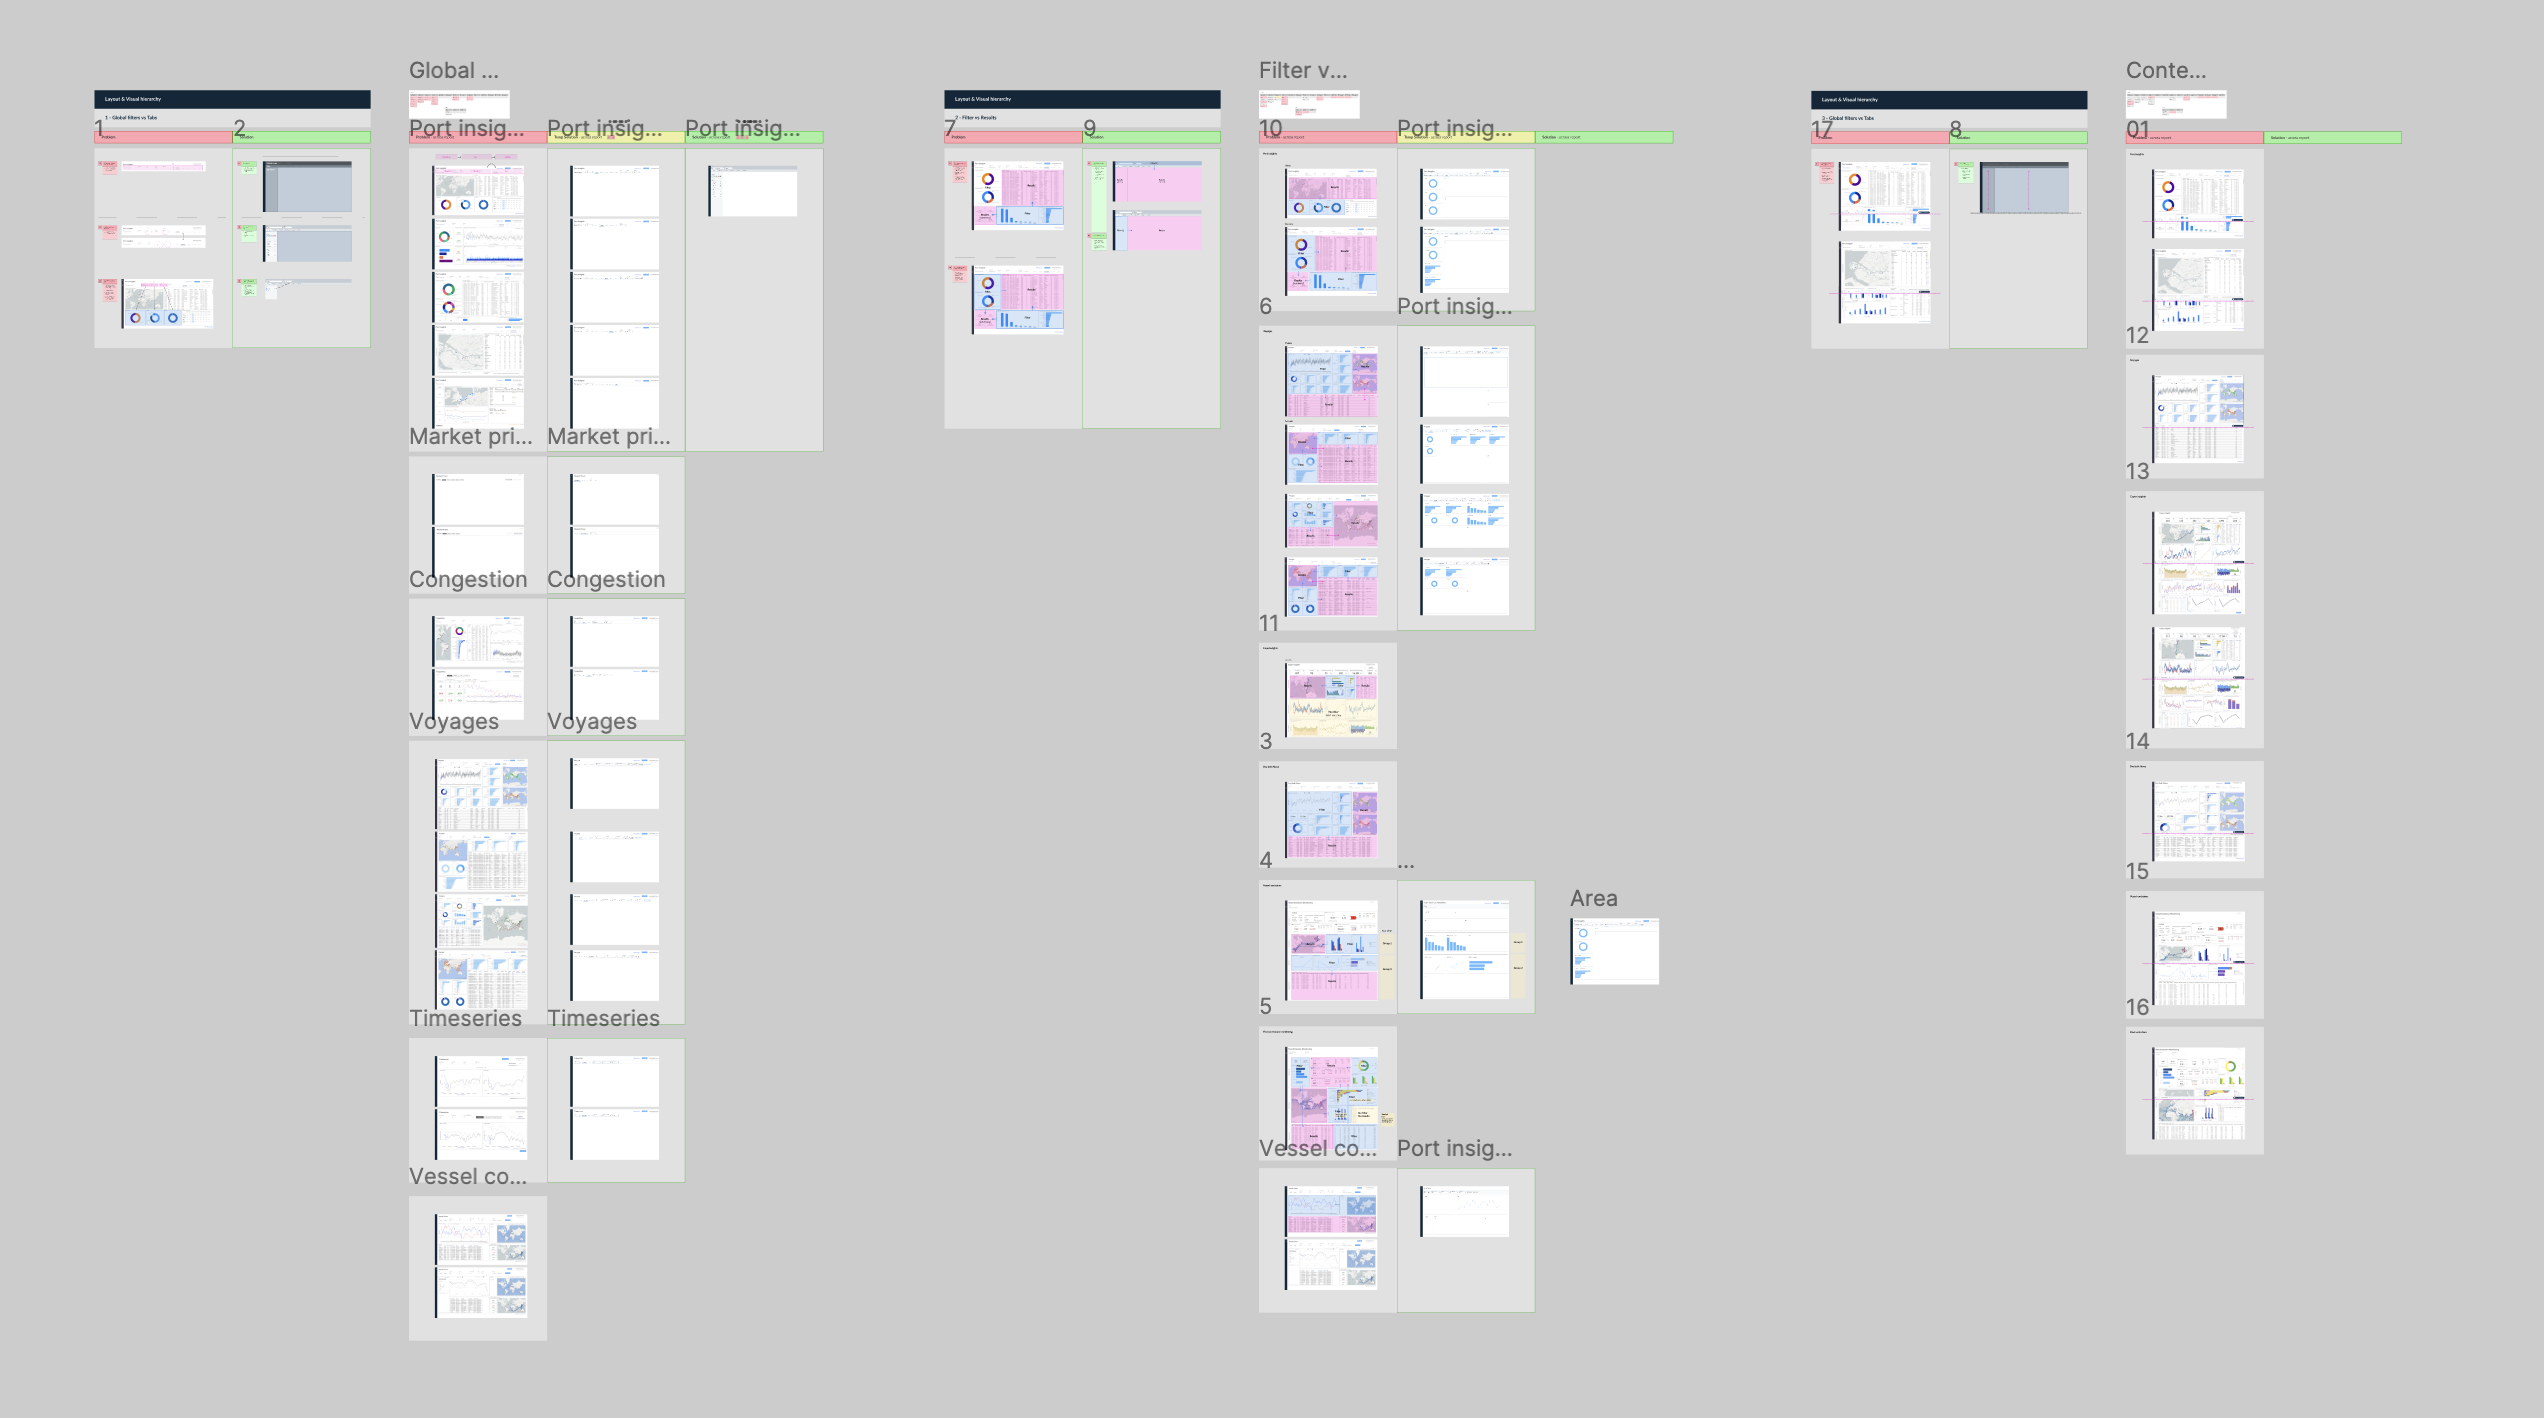
The template was structured by parallel work on the full screens of the 3 reports, as well as early concepts on other ones. The reports were always being worked as a whole, in order to identify interconnections in both data and use / grouping of the components per area.
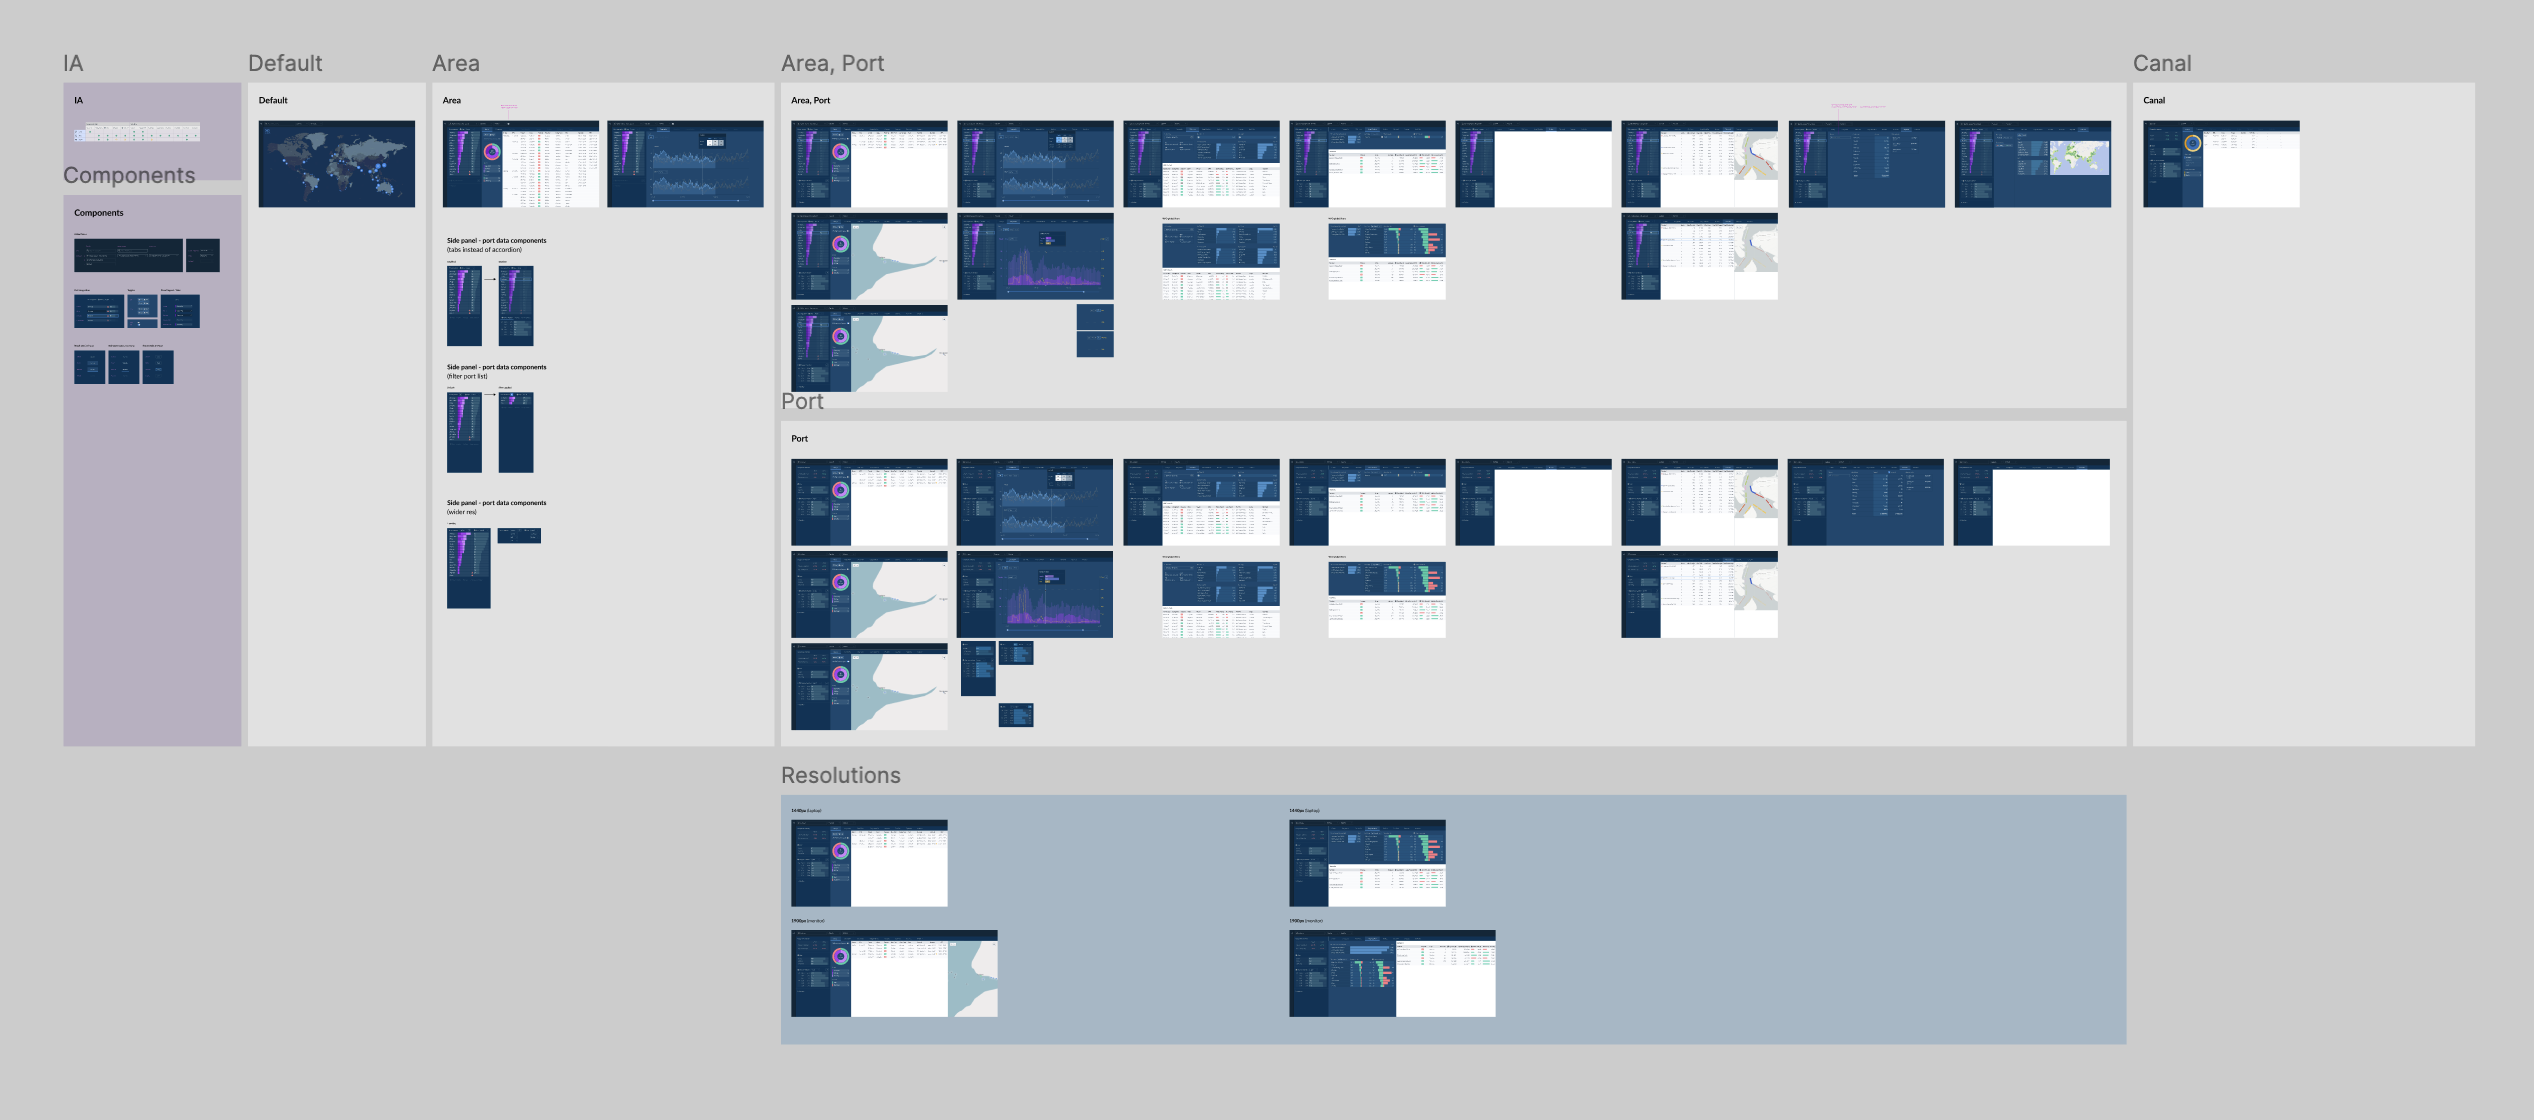
Vision full screens
Area, Area/Port
Port
Canal
Vision into delivery phases
Vision work provided great insights and set a solid direction for the future of reports and potential applications of to the rest of the platform. However, it included too many radical changes that extended the scope of the project and to manage that, deliverables were broken down into 4 development phases. This allows further discovery as we can focus extensively on specific areas per phase, together with better testing as releases are rolled out to users.
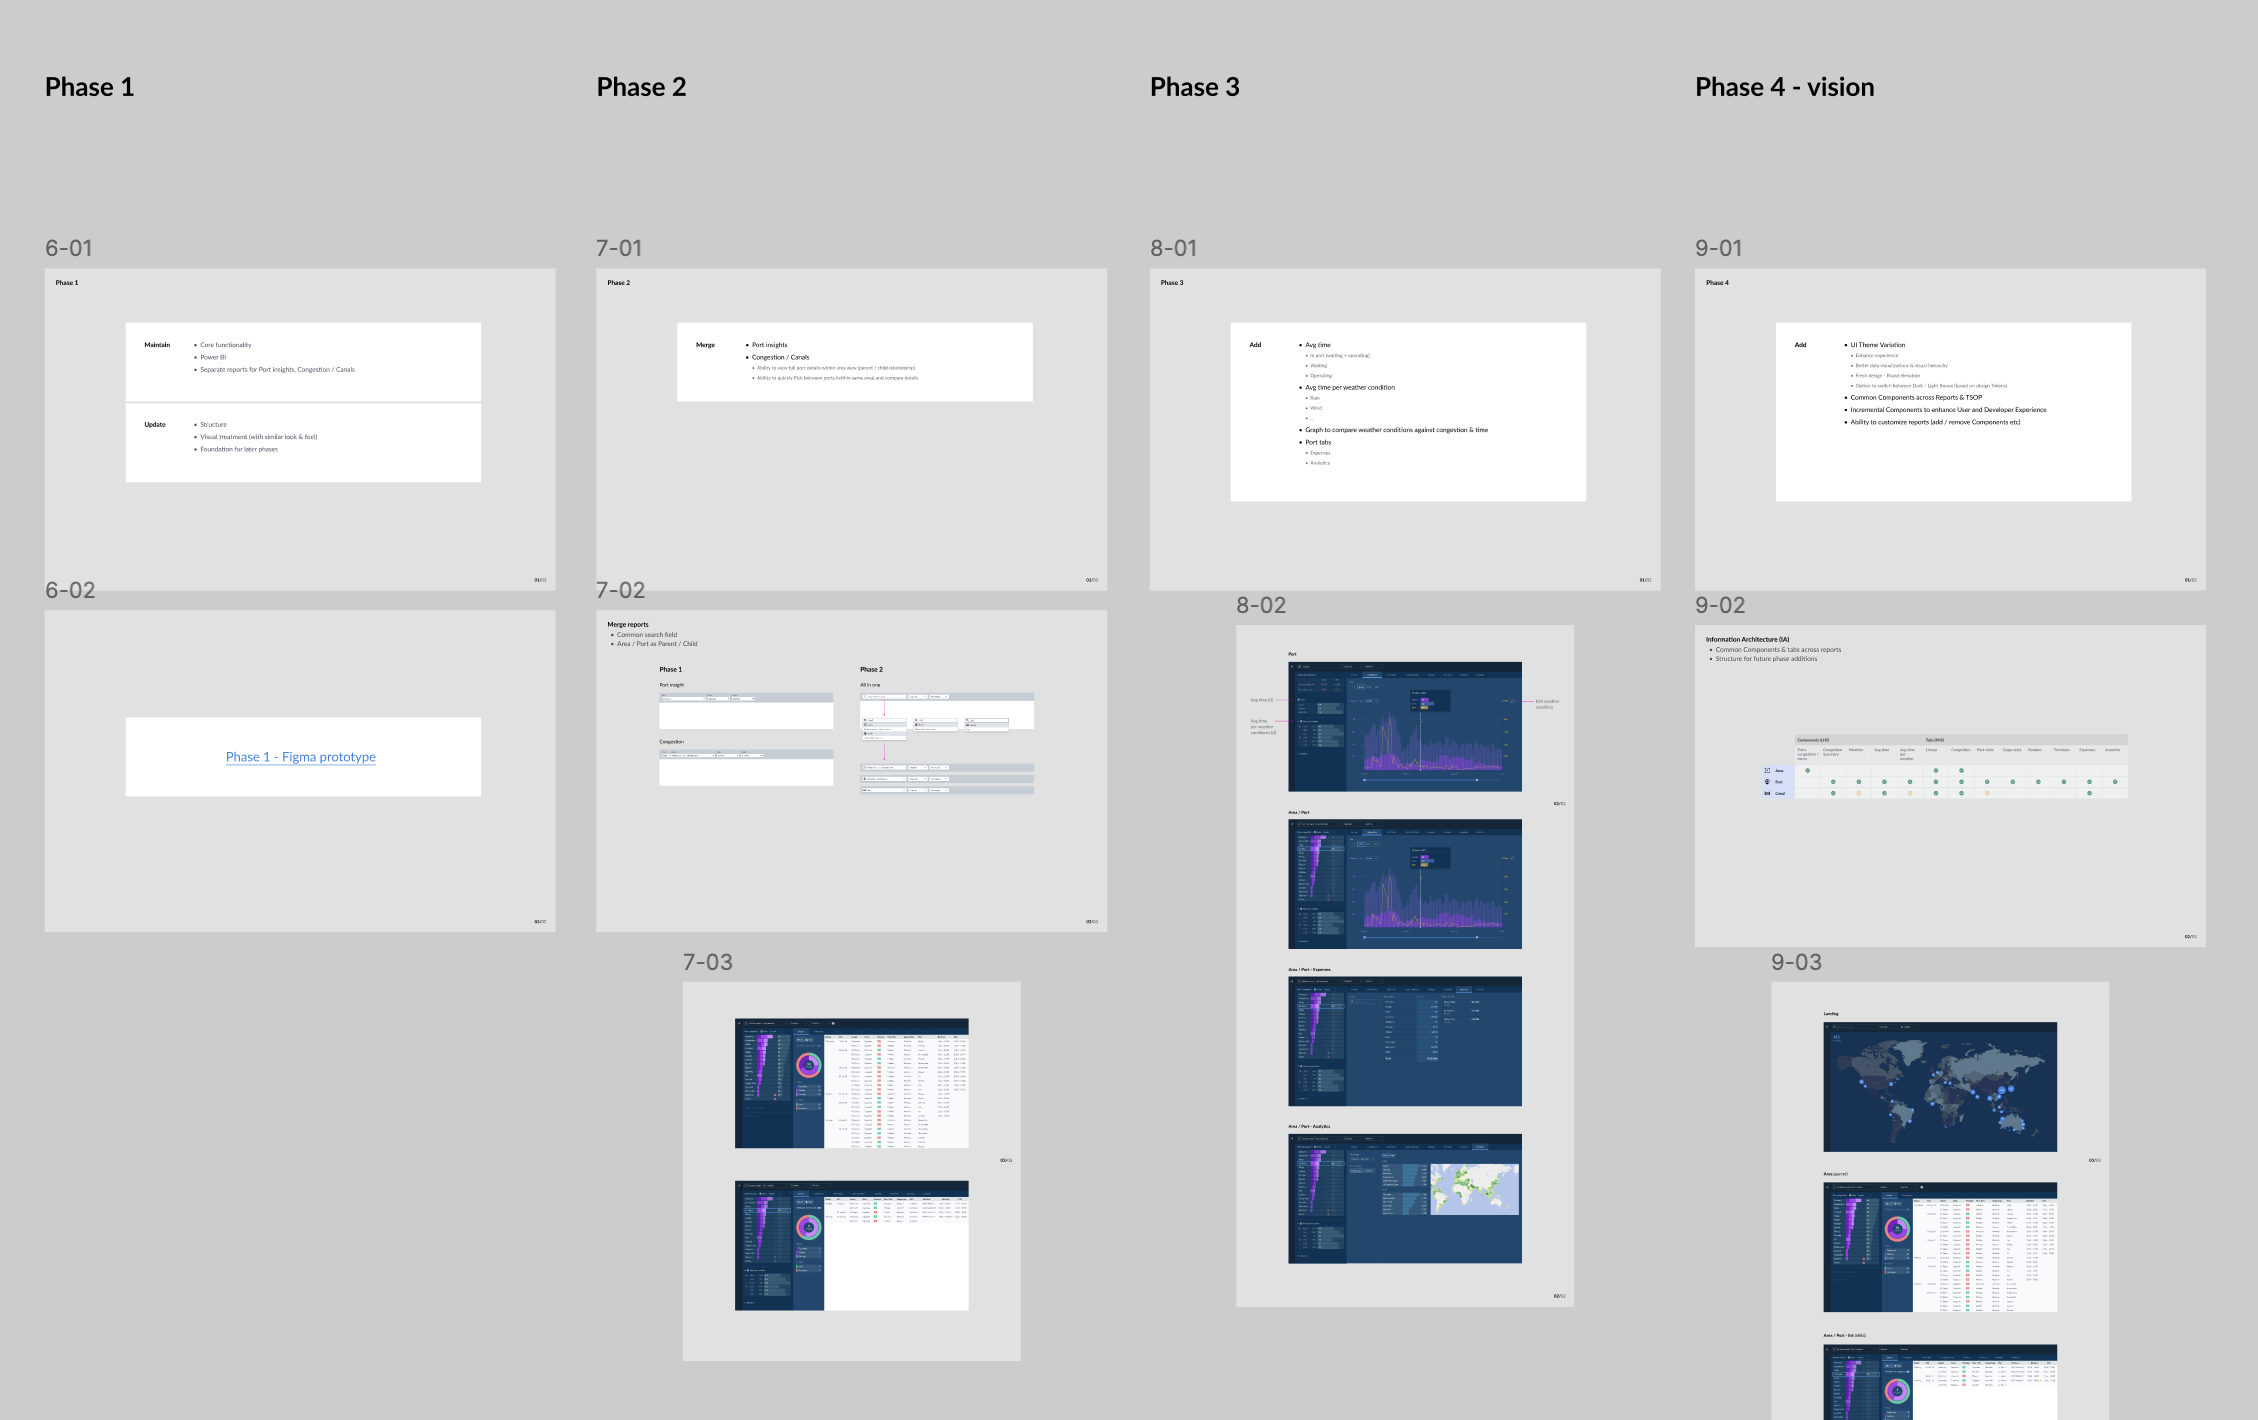
Testing – Phase 1,2 solutions
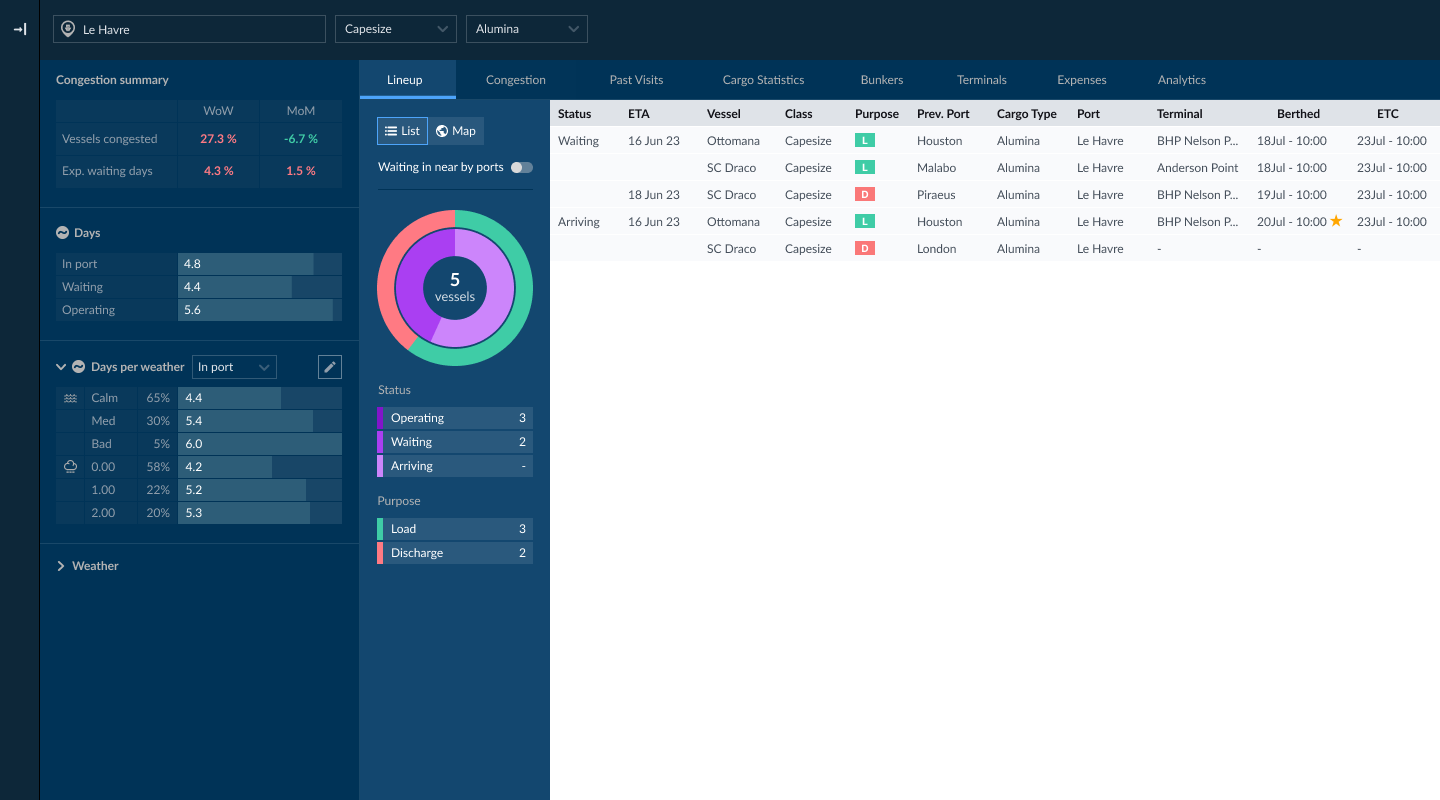
Besides presenting the broader vision work, we were able to test internally first phase solutions with Signal Maritime users (commercial operators). The results were very positive on the fundamental elements of navigation and filtering and also the merge of the 3 reports.
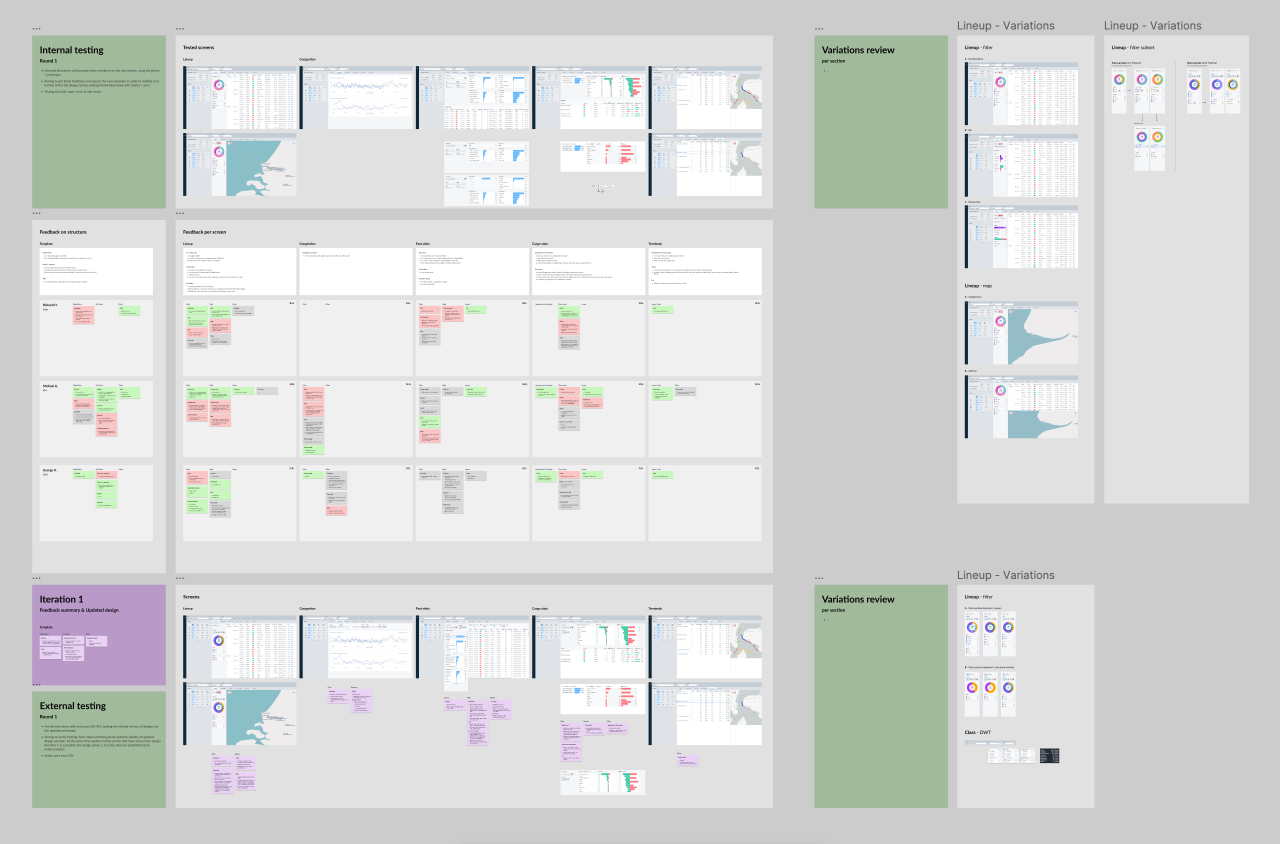
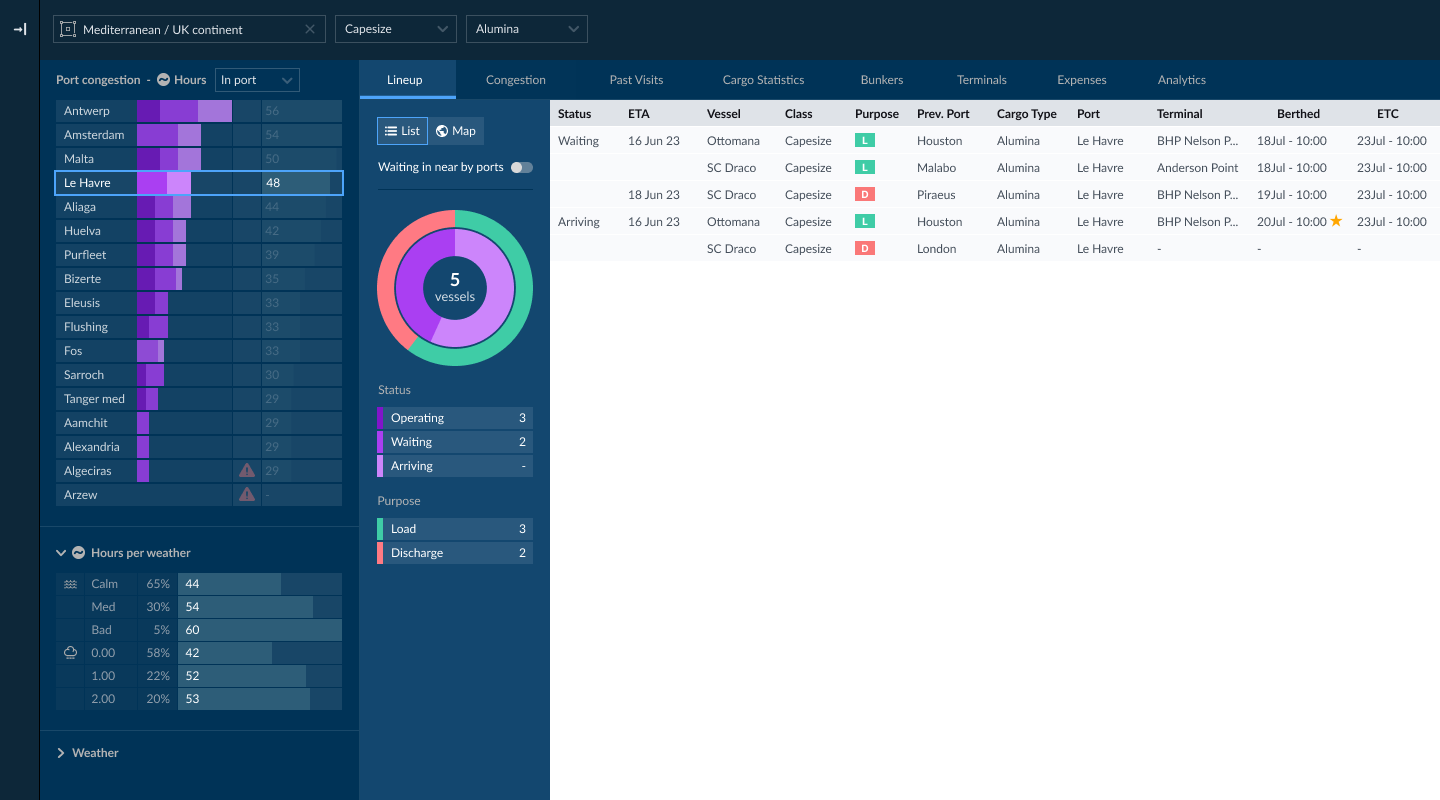
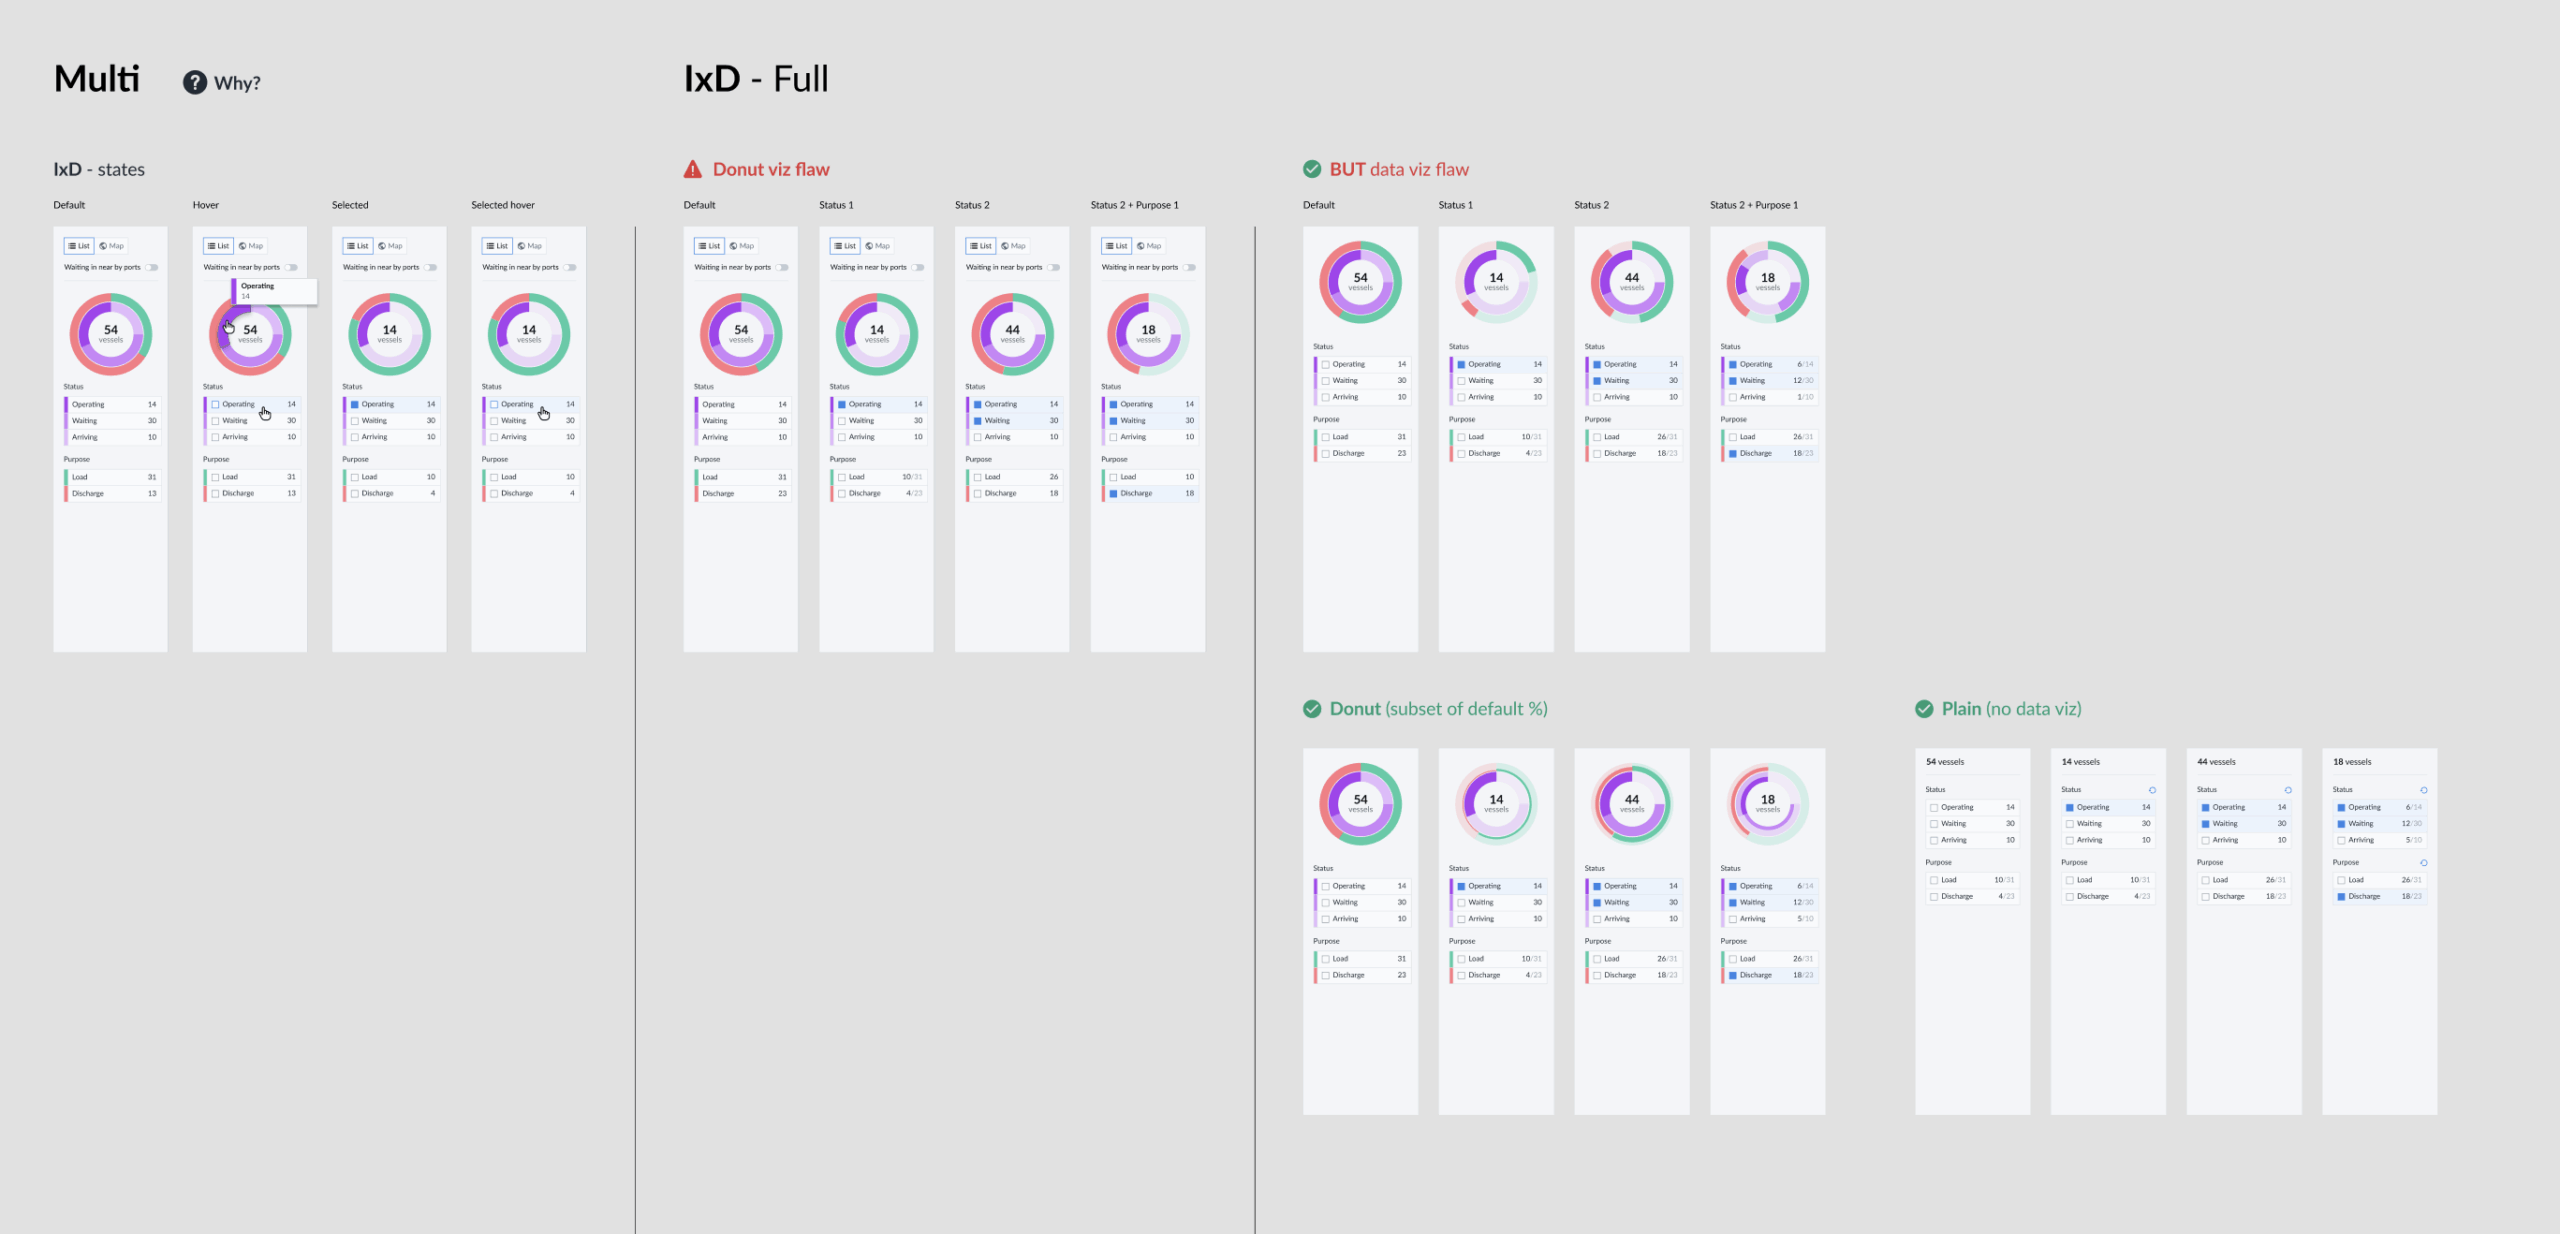
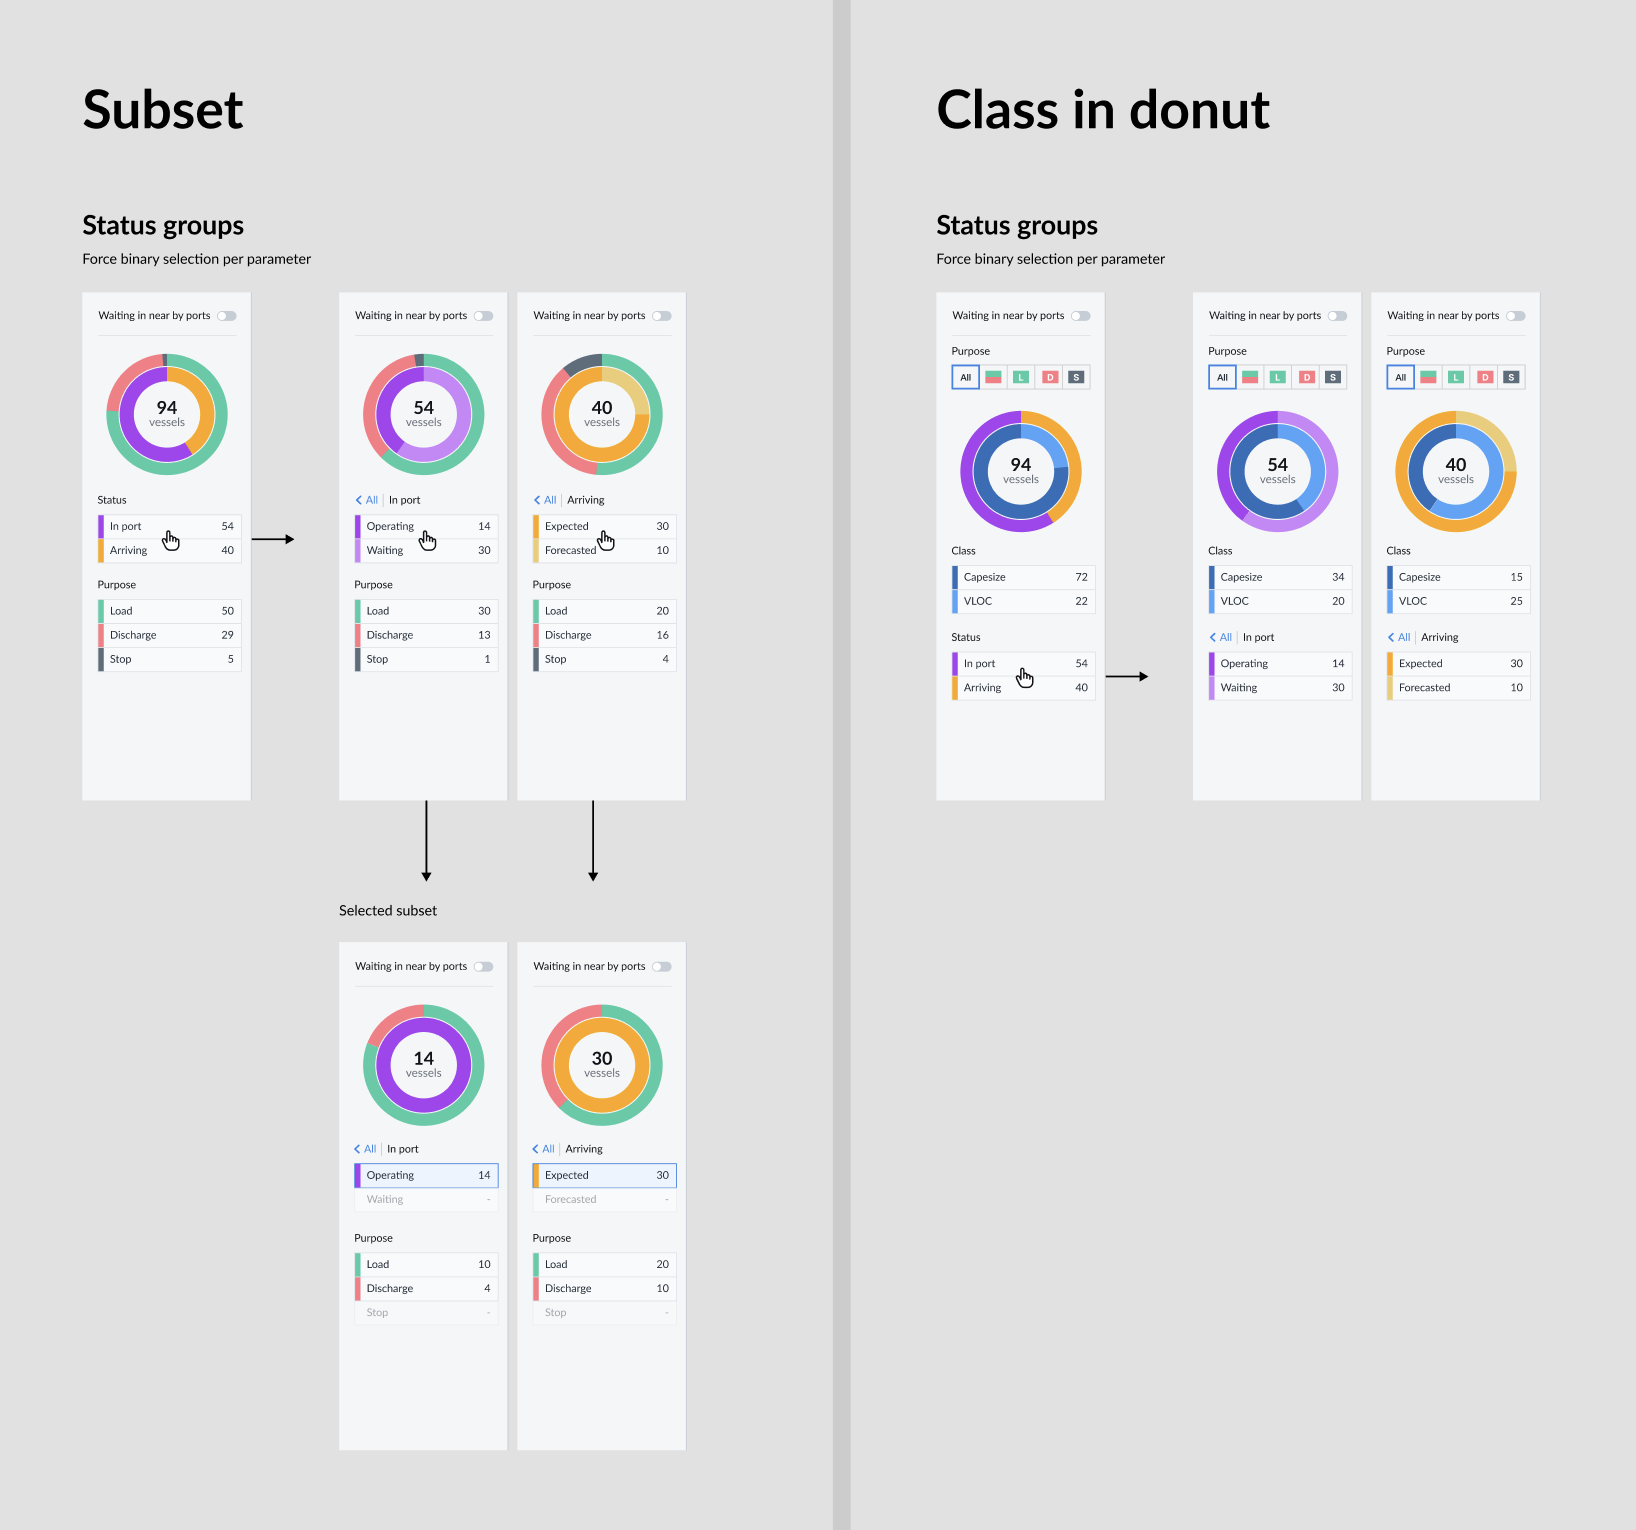
Through these sessions we were able to identify additional scenarios and fine tune the filter component to include all combinations of the available parameters, whilst maintaining the visual data aspect (donut chart).
Previous Project Next Project
- Categories:
- Share Project :
Next Project